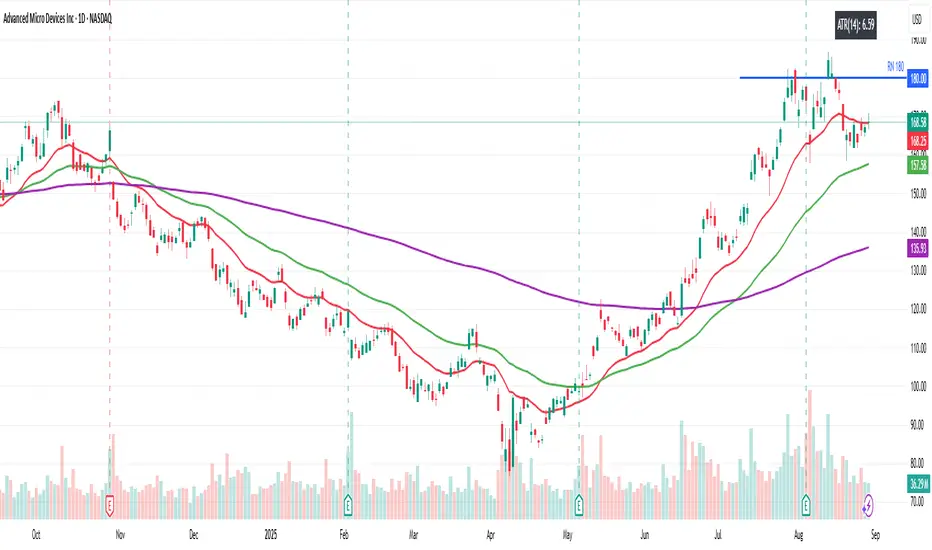
Beyond Insights IndicatorThe Beyond Insights Indicator is a multi-timeframe overlay tool designed for TradingView that displays key Exponential Moving Averages (EMAs) and volatility insights to support various trading strategies. It intelligently adapts its display based on the current chart timeframe to reduce clutter and enhance relevance. Specifically, it shows EMA 6, 18, and 50 when viewing intraday timeframes.
In addition to EMAs, the indicator includes an ATR (Average True Range) calculation with a default length of 14, offering insight into market volatility.
Cari dalam skrip untuk "Exponential Moving Average"
Ultimate Scalping Tool[BullByte]Overview
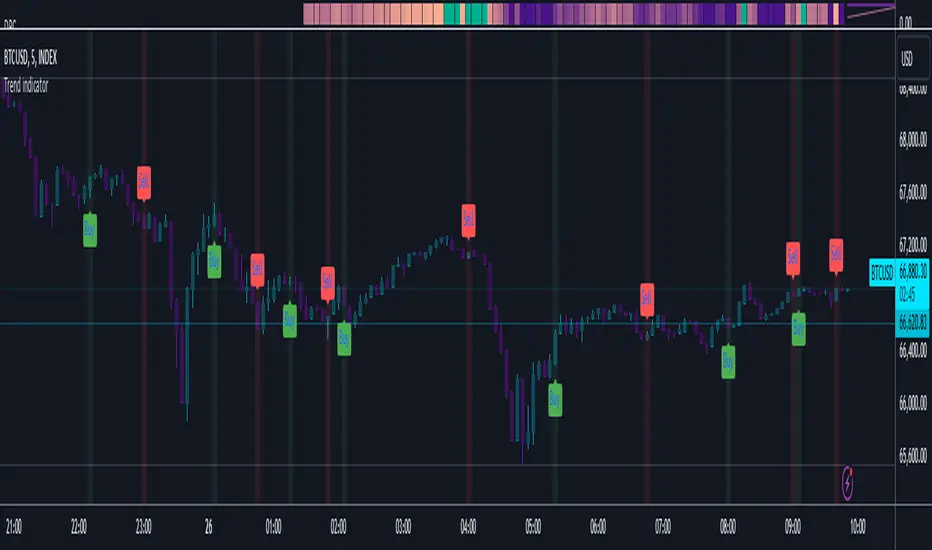
The Ultimate Scalping Tool is an open-source TradingView indicator built for scalpers and short-term traders released under the Mozilla Public License 2.0. It uses a custom Quantum Flux Candle (QFC) oscillator to combine multiple market forces into one visual signal. In plain terms, the script reads momentum, trend strength, volatility, and volume together and plots a special “candlestick” each bar (the QFC) that reflects the overall market bias. This unified view makes it easier to spot entries and exits: the tool labels signals as Strong Buy/Sell, Pullback (a brief retracement in a trend), Early Entry, or Exit Warning . It also provides color-coded alerts and a small dashboard of metrics. In practice, traders see green/red oscillator bars and symbols on the chart when conditions align, helping them scalp or trend-follow without reading multiple separate indicators.
Core Components
Quantum Flux Candle (QFC) Construction
The QFC is the heart of the indicator. Rather than using raw price, it creates a candlestick-like bar from the underlying oscillator values. Each QFC bar has an “open,” “high/low,” and “close” derived from calculated momentum and volatility inputs for that period . In effect, this turns the oscillator into intuitive candle patterns so traders can recognize momentum shifts visually. (For comparison, note that Heikin-Ashi candles “have a smoother look because take an average of the movement”. The QFC instead represents exact oscillator readings, so it reflects true momentum changes without hiding price action.) Colors of QFC bars change dynamically (e.g. green for bullish momentum, red for bearish) to highlight shifts. This is the first open-source QFC oscillator that dynamically weights four non-correlated indicators with moving thresholds, which makes it a unique indicator on its own.
Oscillator Normalization & Adaptive Weights
The script normalizes its oscillator to a fixed scale (for example, a 0–100 range much like the RSI) so that various inputs can be compared fairly. It then applies adaptive weighting: the relative influence of trend, momentum, volatility or volume signals is automatically adjusted based on current market conditions. For instance, in very volatile markets the script might weight volatility more heavily, or in a strong trend it might give extra weight to trend direction. Normalizing data and adjusting weights helps keep the QFC sensitive but stable (normalization ensures all inputs fit a common scale).
Trend/Momentum/Volume/Volatility Fusion
Unlike a typical single-factor oscillator, the QFC oscillator fuses four aspects at once. It may compute, for example, a trend indicator (such as an ADX or moving average slope), a momentum measure (like RSI or Rate-of-Change), a volume-based pressure (similar to MFI/OBV), and a volatility measure (like ATR) . These different values are combined into one composite oscillator. This “multi-dimensional” approach follows best practices of using non-correlated indicators (trend, momentum, volume, volatility) for confirmation. By encoding all these signals in one line, a high QFC reading means that trend, momentum, and volume are all aligned, whereas a neutral reading might mean mixed conditions. This gives traders a comprehensive picture of market strength.
Signal Classification
The script interprets the QFC oscillator to label trades. For example:
• Strong Buy/Sell : Triggered when the oscillator crosses a high-confidence threshold (e.g. breaks clearly above zero with strong slope), indicating a well-confirmed move. This is like seeing a big green/red QFC candle aligned with the trend.
• Pullbacks : Identified when the trend is up but momentum dips briefly. A Pullback Buy appears if the overall trend is bullish but the oscillator has a short retracement – a typical buying opportunity in an uptrend. (A pullback is “a brief decline or pause in a generally upward price trend”.)
• Early Buy/Sell : Marks an initial swing in the oscillator suggesting a possible new trend, before it is fully confirmed. It’s a hint of momentum building (an early-warning signal), not as strong as the confirmed “Strong” signal.
• Exit Warnings : Issued when momentum peaks or reverses. For instance, if the QFC bars reach a high and start turning red/green opposite, the indicator warns that the move may be ending. In other words, a Momentum Peak is the point of maximum strength after which weakness may follow.
These categories correspond to typical trading concepts: Pullback (temporary reversal in an uptrend), Early Buy (an initial bullish cross), Strong Buy (confirmed bullish momentum), and Momentum Peak (peak oscillator value suggesting exhaustion).
Filters (DI Reversal, Dynamic Thresholds, HTF EMA/ADX)
Extra filters help avoid bad trades. A DI Reversal filter uses the +DI/–DI lines (from the ADX system) to require that the trend direction confirms the signal . For example, it might ignore a buy signal if the +DI is still below –DI. Dynamic Thresholds adjust signal levels on-the-fly: rather than fixed “overbought” lines, they move with volatility so signals happen under appropriate market stress. An optional High-Timeframe EMA or ADX filter adds a check against a larger timeframe trend: for instance, only taking a trade if price is above the weekly EMA or if weekly ADX shows a strong trend. (Notably, the ADX is “a technical indicator used by traders to determine the strength of a price trend”, so requiring a high-timeframe ADX avoids trading against the bigger trend.)
Dashboard Metrics & Color Logic
The Dashboard in the Ultimate Scalping Tool (UST) serves as a centralized information hub, providing traders with real-time insights into market conditions, trend strength, momentum, volume pressure, and trade signals. It is highly customizable, allowing users to adjust its appearance and content based on their preferences.
1. Dashboard Layout & Customization
Short vs. Extended Mode : Users can toggle between a compact view (9 rows) and an extended view (13 rows) via the `Short Dashboard` input.
Text Size Options : The dashboard supports three text sizes— Tiny, Small, and Normal —adjustable via the `Dashboard Text Size` input.
Positioning : The dashboard is positioned in the top-right corner by default but can be moved if modified in the script.
2. Key Metrics Displayed
The dashboard presents critical trading metrics in a structured table format:
Trend (TF) : Indicates the current trend direction (Strong Bullish, Moderate Bullish, Sideways, Moderate Bearish, Strong Bearish) based on normalized trend strength (normTrend) .
Momentum (TF) : Displays momentum status (Strong Bullish/Bearish or Neutral) derived from the oscillator's position relative to dynamic thresholds.
Volume (CMF) : Shows buying/selling pressure levels (Very High Buying, High Selling, Neutral, etc.) based on the Chaikin Money Flow (CMF) indicator.
Basic & Advanced Signals:
Basic Signal : Provides simple trade signals (Strong Buy, Strong Sell, Pullback Buy, Pullback Sell, No Trade).
Advanced Signal : Offers nuanced signals (Early Buy/Sell, Momentum Peak, Weakening Momentum, etc.) with color-coded alerts.
RSI : Displays the Relative Strength Index (RSI) value, colored based on overbought (>70), oversold (<30), or neutral conditions.
HTF Filter : Indicates the higher timeframe trend status (Bullish, Bearish, Neutral) when using the Leading HTF Filter.
VWAP : Shows the V olume-Weighted Average Price and whether the current price is above (bullish) or below (bearish) it.
ADX : Displays the Average Directional Index (ADX) value, with color highlighting whether it is rising (green) or falling (red).
Market Mode : Shows the selected market type (Crypto, Stocks, Options, Forex, Custom).
Regime : Indicates volatility conditions (High, Low, Moderate) based on the **ATR ratio**.
3. Filters Status Panel
A secondary panel displays the status of active filters, helping traders quickly assess which conditions are influencing signals:
- DI Reversal Filter: On/Off (confirms reversals before generating signals).
- Dynamic Thresholds: On/Off (adjusts buy/sell thresholds based on volatility).
- Adaptive Weighting: On/Off (auto-adjusts oscillator weights for trend/momentum/volatility).
- Early Signal: On/Off (enables early momentum-based signals).
- Leading HTF Filter: On/Off (applies higher timeframe trend confirmation).
4. Visual Enhancements
Color-Coded Cells : Each metric is color-coded (green for bullish, red for bearish, gray for neutral) for quick interpretation.
Dynamic Background : The dashboard background adapts to market conditions (bullish/bearish/neutral) based on ADX and DI trends.
Customizable Reference Lines : Users can enable/disable fixed reference lines for the oscillator.
How It(QFC) Differs from Traditional Indicators
Quantum Flux Candle (QFC) Versus Heikin-Ashi
Heikin-Ashi candles smooth price by averaging (HA’s open/close use averages) so they show trend clearly but hide true price (the current HA bar’s close is not the real price). QFC candles are different: they are oscillator values, not price averages . A Heikin-Ashi chart “has a smoother look because it is essentially taking an average of the movement”, which can cause lag. The QFC instead shows the raw combined momentum each bar, allowing faster recognition of shifts. In short, HA is a smoothed price chart; QFC is a momentum-based chart.
Versus Standard Oscillators
Common oscillators like RSI or MACD use fixed formulas on price (or price+volume). For example, RSI “compares gains and losses and normalizes this value on a scale from 0 to 100”, reflecting pure price momentum. MFI is similar but adds volume. These indicators each show one dimension: momentum or volume. The Ultimate Scalping Tool’s QFC goes further by integrating trend strength and volatility too. In practice, this means a move that looks strong on RSI might be downplayed by low volume or weak trend in QFC. As one source notes, using multiple non-correlated indicators (trend, momentum, volume, volatility) provides a more complete market picture. The QFC’s multi-factor fusion is unique – it is effectively a multi-dimensional oscillator rather than a traditional single-input one.
Signal Style
Traditional oscillators often use crossovers (RSI crossing 50) or fixed zones (MACD above zero) for signals. The Ultimate Scalping Tool’s signals are custom-classified: it explicitly labels pullbacks, early entries, and strong moves. These terms go beyond a typical indicator’s generic “buy”/“sell.” In other words, it packages a strategy around the oscillator, which traders can backtest or observe without reading code.
Key Term Definitions
• Pullback : A short-term dip or consolidation in an uptrend. In this script, a Pullback Buy appears when price is generally rising but shows a brief retracement. (As defined by Investopedia, a pullback is “a brief decline or pause in a generally upward price trend”.)
• Early Buy/Sell : An initial or tentative entry signal. It means the oscillator first starts turning positive (or negative) before a full trend has developed. It’s an early indication that a trend might be starting.
• Strong Buy/Sell : A confident entry signal when multiple conditions align. This label is used when momentum is already strong and confirmed by trend/volume filters, offering a higher-probability trade.
• Momentum Peak : The point where bullish (or bearish) momentum reaches its maximum before weakening. When the oscillator value stops rising (or falling) and begins to reverse, the script flags it as a peak – signaling that the current move could be overextended.
What is the Flux MA?
The Flux MA (Moving Average) is an Exponential Moving Average (EMA) applied to a normalized oscillator, referred to as FM . Its purpose is to smooth out the fluctuations of the oscillator, providing a clearer picture of the underlying trend direction and strength. Think of it as a dynamic baseline that the oscillator moves above or below, helping you determine whether the market is trending bullish or bearish.
How it’s calculated (Flux MA):
1.The oscillator is normalized (scaled to a range, typically between 0 and 1, using a default scale factor of 100.0).
2.An EMA is applied to this normalized value (FM) over a user-defined period (default is 10 periods).
3.The result is rescaled back to the oscillator’s original range for plotting.
Why it matters : The Flux MA acts like a support or resistance level for the oscillator, making it easier to spot trend shifts.
Color of the Flux Candle
The Quantum Flux Candle visualizes the normalized oscillator (FM) as candlesticks, with colors that indicate specific market conditions based on the relationship between the FM and the Flux MA. Here’s what each color means:
• Green : The FM is above the Flux MA, signaling bullish momentum. This suggests the market is trending upward.
• Red : The FM is below the Flux MA, signaling bearish momentum. This suggests the market is trending downward.
• Yellow : Indicates strong buy conditions (e.g., a "Strong Buy" signal combined with a positive trend). This is a high-confidence signal to go long.
• Purple : Indicates strong sell conditions (e.g., a "Strong Sell" signal combined with a negative trend). This is a high-confidence signal to go short.
The candle mode shows the oscillator’s open, high, low, and close values for each period, similar to price candlesticks, but it’s the color that provides the quick visual cue for trading decisions.
How to Trade the Flux MA with Respect to the Candle
Trading with the Flux MA and Quantum Flux Candle involves using the MA as a trend indicator and the candle colors as entry and exit signals. Here’s a step-by-step guide:
1. Identify the Trend Direction
• Bullish Trend : The Flux Candle is green and positioned above the Flux MA. This indicates upward momentum.
• Bearish Trend : The Flux Candle is red and positioned below the Flux MA. This indicates downward momentum.
The Flux MA serves as the reference line—candles above it suggest buying pressure, while candles below it suggest selling pressure.
2. Interpret Candle Colors for Trade Signals
• Green Candle : General bullish momentum. Consider entering or holding a long position.
• Red Candle : General bearish momentum. Consider entering or holding a short position.
• Yellow Candle : A strong buy signal. This is an ideal time to enter a long trade.
• Purple Candle : A strong sell signal. This is an ideal time to enter a short trade.
3. Enter Trades Based on Crossovers and Colors
• Long Entry : Enter a buy position when the Flux Candle turns green and crosses above the Flux MA. If it turns yellow, this is an even stronger signal to go long.
• Short Entry : Enter a sell position when the Flux Candle turns red and crosses below the Flux MA. If it turns purple, this is an even stronger signal to go short.
4. Exit Trades
• Exit Long : Close your buy position when the Flux Candle turns red or crosses below the Flux MA, indicating the bullish trend may be reversing.
• Exit Short : Close your sell position when the Flux Candle turns green or crosses above the Flux MA, indicating the bearish trend may be reversing.
•You might also exit a long trade if the candle changes from yellow to green (weakening strong buy signal) or a short trade from purple to red (weakening strong sell signal).
5. Use Additional Confirmation
To avoid false signals, combine the Flux MA and candle signals with other indicators or dashboard metrics (e.g., trend strength, momentum, or volume pressure). For example:
•A yellow candle with a " Strong Bullish " trend and high buying volume is a robust long signal.
•A red candle with a " Moderate Bearish " trend and neutral momentum might need more confirmation before shorting.
Practical Example
Imagine you’re scalping a cryptocurrency:
• Long Trade : The Flux Candle turns yellow and is above the Flux MA, with the dashboard showing "Strong Buy" and high buying volume. You enter a long position. You exit when the candle turns red and dips below the Flux MA.
• Short Trade : The Flux Candle turns purple and crosses below the Flux MA, with a "Strong Sell" signal on the dashboard. You enter a short position. You exit when the candle turns green and crosses above the Flux MA.
Market Presets and Adaptation
This indicator is designed to work on any market with candlestick price data (stocks, crypto, forex, indices, etc.). To handle different behavior, it provides presets for major asset classes. Selecting a “Stocks,” “Crypto,” “Forex,” or “Options” preset automatically loads a set of parameter values optimized for that market . For example, a crypto preset might use a shorter lookback or higher sensitivity to account for crypto’s high volatility, while a stocks preset might use slightly longer smoothing since stocks often trend more slowly. In practice, this means the same core QFC logic applies across markets, but the thresholds and smoothing adjust so signals remain relevant for each asset type.
Usage Guidelines
• Recommended Timeframes : Optimized for 1 minute to 15 minute intraday charts. Can also be used on higher timeframes for short term swings.
• Market Types : Select “Crypto,” “Stocks,” “Forex,” or “Options” to auto tune periods, thresholds and weights. Use “Custom” to manually adjust all inputs.
• Interpreting Signals : Always confirm a signal by checking that trend, volume, and VWAP agree on the dashboard. A green “Strong Buy” arrow with green trend, green volume, and price > VWAP is highest probability.
• Adjusting Sensitivity : To reduce false signals in fast markets, enable DI Reversal Confirmation and Dynamic Thresholds. For more frequent entries in trending environments, enable Early Entry Trigger.
• Risk Management : This tool does not plot stop loss or take profit levels. Users should define their own risk parameters based on support/resistance or volatility bands.
Background Shading
To give you an at-a-glance sense of market regime without reading numbers, the indicator automatically tints the chart background in three modes—neutral, bullish and bearish—with two levels of intensity (light vs. dark):
Neutral (Gray)
When ADX is below 20 the market is considered “no trend” or too weak to trade. The background fills with a light gray (high transparency) so you know to sit on your hands.
Bullish (Green)
As soon as ADX rises above 20 and +DI exceeds –DI, the background turns a semi-transparent green, signaling an emerging uptrend. When ADX climbs above 30 (strong trend), the green becomes more opaque—reminding you that trend-following signals (Strong Buy, Pullback) carry extra weight.
Bearish (Red)
Similarly, if –DI exceeds +DI with ADX >20, you get a light red tint for a developing downtrend, and a darker, more solid red once ADX surpasses 30.
By dynamically varying both hue (green vs. red vs. gray) and opacity (light vs. dark), the background instantly communicates trend strength and direction—so you always know whether to favor breakout-style entries (in a strong trend) or stay flat during choppy, low-ADX conditions.
The setup shown in the above chart snapshot is BTCUSD 15 min chart : Binance for reference.
Disclaimer
No indicator guarantees profits. Backtest or paper trade this tool to understand its behavior in your market. Always use proper position sizing and stop loss orders.
Good luck!
- BullByte

Why EMA Isn't What You Think It IsMany new traders adopt the Exponential Moving Average (EMA) believing it's simply a "better Simple Moving Average (SMA)". This common misconception leads to fundamental misunderstandings about how EMA works and when to use it.
EMA and SMA differ at their core. SMA use a window of finite number of data points, giving equal weight to each data point in the calculation period. This makes SMA a Finite Impulse Response (FIR) filter in signal processing terms. Remember that FIR means that "all that we need is the 'period' number of data points" to calculate the filter value. Anything beyond the given period is not relevant to FIR filters – much like how a security camera with 14-day storage automatically overwrites older footage, making last month's activity completely invisible regardless of how important it might have been.
EMA, however, is an Infinite Impulse Response (IIR) filter. It uses ALL historical data, with each past price having a diminishing - but never zero - influence on the calculated value. This creates an EMA response that extends infinitely into the past—not just for the last N periods. IIR filters cannot be precise if we give them only a 'period' number of data to work on - they will be off-target significantly due to lack of context, like trying to understand Game of Thrones by watching only the final season and wondering why everyone's so upset about that dragon lady going full pyromaniac.
If we only consider a number of data points equal to the EMA's period, we are capturing no more than 86.5% of the total weight of the EMA calculation. Relying on he period window alone (the warm-up period) will provide only 1 - (1 / e^2) weights, which is approximately 1−0.1353 = 0.8647 = 86.5%. That's like claiming you've read a book when you've skipped the first few chapters – technically, you got most of it, but you probably miss some crucial early context.
▶️ What is period in EMA used for?
What does a period parameter really mean for EMA? When we select a 15-period EMA, we're not selecting a window of 15 data points as with an SMA. Instead, we are using that number to calculate a decay factor (α) that determines how quickly older data loses influence in EMA result. Every trader knows EMA calculation: α = 1 / (1+period) – or at least every trader claims to know this while secretly checking the formula when they need it.
Thinking in terms of "period" seriously restricts EMA. The α parameter can be - should be! - any value between 0.0 and 1.0, offering infinite tuning possibilities of the indicator. When we limit ourselves to whole-number periods that we use in FIR indicators, we can only access a small subset of possible IIR calculations – it's like having access to the entire RGB color spectrum with 16.7 million possible colors but stubbornly sticking to the 8 basic crayons in a child's first art set because the coloring book only mentioned those by name.
For example:
Period 10 → alpha = 0.1818
Period 11 → alpha = 0.1667
What about wanting an alpha of 0.17, which might yield superior returns in your strategy that uses EMA? No whole-number period can provide this! Direct α parameterization offers more precision, much like how an analog tuner lets you find the perfect radio frequency while digital presets force you to choose only from predetermined stations, potentially missing the clearest signal sitting right between channels.
Sidenote: the choice of α = 1 / (1+period) is just a convention from 1970s, probably started by J. Welles Wilder, who popularized the use of the 14-day EMA. It was designed to create an approximate equivalence between EMA and SMA over the same number of periods, even thought SMA needs a period window (as it is FIR filter) and EMA doesn't. In reality, the decay factor α in EMA should be allowed any valye between 0.0 and 1.0, not just some discrete values derived from an integer-based period! Algorithmic systems should find the best α decay for EMA directly, allowing the system to fine-tune at will and not through conversion of integer period to float α decay – though this might put a few traditionalist traders into early retirement. Well, to prevent that, most traditionalist implementations of EMA only use period and no alpha at all. Heaven forbid we disturb people who print their charts on paper, draw trendlines with rulers, and insist the market "feels different" since computers do algotrading!
▶️ Calculating EMAs Efficiently
The standard textbook formula for EMA is:
EMA = CurrentPrice × alpha + PreviousEMA × (1 - alpha)
But did you know that a more efficient version exists, once you apply a tiny bit of high school algebra:
EMA = alpha × (CurrentPrice - PreviousEMA) + PreviousEMA
The first one requires three operations: 2 multiplications + 1 addition. The second one also requires three ops: 1 multiplication + 1 addition + 1 subtraction.
That's pathetic, you say? Not worth implementing? In most computational models, multiplications cost much more than additions/subtractions – much like how ordering dessert costs more than asking for a water refill at restaurants.
Relative CPU cost of float operations :
Addition/Subtraction: ~1 cycle
Multiplication: ~5 cycles (depending on precision and architecture)
Now you see the difference? 2 * 5 + 1 = 11 against 5 + 1 + 1 = 7. That is ≈ 36.36% efficiency gain just by swapping formulas around! And making your high school math teacher proud enough to finally put your test on the refrigerator.
▶️ The Warmup Problem: how to start the EMA sequence right
How do we calculate the first EMA value when there's no previous EMA available? Let's see some possible options used throughout the history:
Start with zero : EMA(0) = 0. This creates stupidly large distortion until enough bars pass for the horrible effect to diminish – like starting a trading account with zero balance but backdating a year of missed trades, then watching your balance struggle to climb out of a phantom debt for months.
Start with first price : EMA(0) = first price. This is better than starting with zero, but still causes initial distortion that will be extra-bad if the first price is an outlier – like forming your entire opinion of a stock based solely on its IPO day price, then wondering why your model is tanking for weeks afterward.
Use SMA for warmup : This is the tradition from the pencil-and-paper era of technical analysis – when calculators were luxury items and "algorithmic trading" meant your broker had neat handwriting. We first calculate an SMA over the initial period, then kickstart the EMA with this average value. It's widely used due to tradition, not merit, creating a mathematical Frankenstein that uses an FIR filter (SMA) during the initial period before abruptly switching to an IIR filter (EMA). This methodology is so aesthetically offensive (abrupt kink on the transition from SMA to EMA) that charting platforms hide these early values entirely, pretending EMA simply doesn't exist until the warmup period passes – the technical analysis equivalent of sweeping dust under the rug.
Use WMA for warmup : This one was never popular because it is harder to calculate with a pencil - compared to using simple SMA for warmup. Weighted Moving Average provides a much better approximation of a starting value as its linear descending profile is much closer to the EMA's decay profile.
These methods all share one problem: they produce inaccurate initial values that traders often hide or discard, much like how hedge funds conveniently report awesome performance "since strategy inception" only after their disastrous first quarter has been surgically removed from the track record.
▶️ A Better Way to start EMA: Decaying compensation
Think of it this way: An ideal EMA uses an infinite history of prices, but we only have data starting from a specific point. This creates a problem - our EMA starts with an incorrect assumption that all previous prices were all zero, all close, or all average – like trying to write someone's biography but only having information about their life since last Tuesday.
But there is a better way. It requires more than high school math comprehension and is more computationally intensive, but is mathematically correct and numerically stable. This approach involves compensating calculated EMA values for the "phantom data" that would have existed before our first price point.
Here's how phantom data compensation works:
We start our normal EMA calculation:
EMA_today = EMA_yesterday + α × (Price_today - EMA_yesterday)
But we add a correction factor that adjusts for the missing history:
Correction = 1 at the start
Correction = Correction × (1-α) after each calculation
We then apply this correction:
True_EMA = Raw_EMA / (1-Correction)
This correction factor starts at 1 (full compensation effect) and gets exponentially smaller with each new price bar. After enough data points, the correction becomes so small (i.e., below 0.0000000001) that we can stop applying it as it is no longer relevant.
Let's see how this works in practice:
For the first price bar:
Raw_EMA = 0
Correction = 1
True_EMA = Price (since 0 ÷ (1-1) is undefined, we use the first price)
For the second price bar:
Raw_EMA = α × (Price_2 - 0) + 0 = α × Price_2
Correction = 1 × (1-α) = (1-α)
True_EMA = α × Price_2 ÷ (1-(1-α)) = Price_2
For the third price bar:
Raw_EMA updates using the standard formula
Correction = (1-α) × (1-α) = (1-α)²
True_EMA = Raw_EMA ÷ (1-(1-α)²)
With each new price, the correction factor shrinks exponentially. After about -log₁₀(1e-10)/log₁₀(1-α) bars, the correction becomes negligible, and our EMA calculation matches what we would get if we had infinite historical data.
This approach provides accurate EMA values from the very first calculation. There's no need to use SMA for warmup or discard early values before output converges - EMA is mathematically correct from first value, ready to party without the awkward warmup phase.
Here is Pine Script 6 implementation of EMA that can take alpha parameter directly (or period if desired), returns valid values from the start, is resilient to dirty input values, uses decaying compensator instead of SMA, and uses the least amount of computational cycles possible.
// Enhanced EMA function with proper initialization and efficient calculation
ema(series float source, simple int period=0, simple float alpha=0)=>
// Input validation - one of alpha or period must be provided
if alpha<=0 and period<=0
runtime.error("Alpha or period must be provided")
// Calculate alpha from period if alpha not directly specified
float a = alpha > 0 ? alpha : 2.0 / math.max(period, 1)
// Initialize variables for EMA calculation
var float ema = na // Stores raw EMA value
var float result = na // Stores final corrected EMA
var float e = 1.0 // Decay compensation factor
var bool warmup = true // Flag for warmup phase
if not na(source)
if na(ema)
// First value case - initialize EMA to zero
// (we'll correct this immediately with the compensation)
ema := 0
result := source
else
// Standard EMA calculation (optimized formula)
ema := a * (source - ema) + ema
if warmup
// During warmup phase, apply decay compensation
e *= (1-a) // Update decay factor
float c = 1.0 / (1.0 - e) // Calculate correction multiplier
result := c * ema // Apply correction
// Stop warmup phase when correction becomes negligible
if e <= 1e-10
warmup := false
else
// After warmup, EMA operates without correction
result := ema
result // Return the properly compensated EMA value
▶️ CONCLUSION
EMA isn't just a "better SMA"—it is a fundamentally different tool, like how a submarine differs from a sailboat – both float, but the similarities end there. EMA responds to inputs differently, weighs historical data differently, and requires different initialization techniques.
By understanding these differences, traders can make more informed decisions about when and how to use EMA in trading strategies. And as EMA is embedded in so many other complex and compound indicators and strategies, if system uses tainted and inferior EMA calculatiomn, it is doing a disservice to all derivative indicators too – like building a skyscraper on a foundation of Jell-O.
The next time you add an EMA to your chart, remember: you're not just looking at a "faster moving average." You're using an INFINITE IMPULSE RESPONSE filter that carries the echo of all previous price actions, properly weighted to help make better trading decisions.
EMA done right might significantly improve the quality of all signals, strategies, and trades that rely on EMA somewhere deep in its algorithmic bowels – proving once again that math skills are indeed useful after high school, no matter what your guidance counselor told you.

ATR Strength Index~~~~~~~ATRRSI~~~~~~~~~
Understanding the ATR Strength IndexThe "ATR Strength Index" (ATR SI) is a custom technical indicator derived by applying the calculation methodology of the Relative Strength Index (RSI) to the values of the Average True Range (ATR).
While the standard RSI measures the momentum of price changes, the ATR SI measures the momentum of volatility itself, as represented by the ATR.It is important to note that this is not a standard, widely recognised indicator like the traditional RSI or ATR.
It's a custom construction designed to provide a different perspective on market dynamics – specifically, the speed and magnitude of changes in volatility.
How it is Calculated
The calculation of the ATR Strength Index follows the same steps as the standard RSI, but the input data is the ATR value for each period, rather than the price.Let ATRi be the Average True Range value for the current period i.Let ATRi−1 be the Average True Range value for the previous period i−1.Calculate the period-over-period change in ATR:ΔATRi=ATRi−ATRi−1Separate ATR Gains and ATR Losses:If ΔATRi>0, then ATR,Gaini=ΔATRi and ATR,Lossi=0.If ΔATRi<0, then ATR,Gaini=0 and ATR,Lossi=∣ΔATRi∣.If ΔATRi=0, then ATR,Gaini=0 and ATR,Lossi=0.Calculate the Smoothed Average ATR Gain and Average ATR Loss over a specified lookback period (let's call this the "RSI Length" or n).
This typically uses a smoothing method similar to Wilder's original RSI calculation (a modified moving average or exponential moving average).Average,ATR,Gainn=Smoothed Average of ATR,Gain over n periodsAverage,ATR,Lossn=Smoothed Average of ATR,Loss over n periodsCalculate the ATR Relative Strength (ATR RS):ATR,RSn=Average,ATR,LossnAverage,ATR,GainnCalculate the ATR Strength Index:ATR,SIn=100−1+ATR,RSn100The resulting index oscillates between 0 and 100, just like the standard RSI.
How to Use It
Interpreting the ATR Strength Index focuses on the momentum of volatility rather than price momentum:High Values (e.g., above 70): Indicate that volatility (as measured by ATR) has been increasing rapidly over the chosen period.
This could suggest a market transitioning from a period of low volatility to high volatility, potentially preceding or accompanying strong directional price moves or increased choppiness.Low Values (e.g., below 30): Indicate that volatility has been decreasing rapidly.
This could suggest a market transitioning from high volatility to low volatility, potentially entering a period of consolidation or ranging price action.Midline (50): Represents a balance between increasing and decreasing volatility momentum.Divergence: You could potentially look for divergence between the ATR value itself and the ATR Strength Index. For example, if ATR is making higher highs but the ATR SI is making lower highs, it might suggest that while volatility is still increasing, the speed of that increase is slowing down. The interpretation and reliability of such divergence would need careful testing.
This indicator is best used as a supplementary tool to gain insight into the underlying volatility dynamics of the market, rather than as a primary signal generator for price direction.
It can help in understanding the current market environment – whether volatility is picking up or dying down – which can inform the suitability of different trading strategies (e.g., trend-following strategies might be more effective when volatility momentum is high, while range-bound strategies might suit periods of low volatility momentum).
Uniqueness
The ATR Strength Index is unique because it applies a momentum oscillator's logic (RSI) to a volatility indicator's output (ATR).Standard RSI: Focuses on the directional force of price movements.Standard ATR: Measures the amount of volatility, regardless of direction.ATR Strength Index: Measures the speed and direction of change in volatility.
It provides a perspective that neither the standard RSI nor ATR offers on their own – a quantified measure of how quickly the market's choppiness or range is expanding or contracting. This can be valuable for traders who incorporate volatility analysis into their decision-making process.In summary, the ATR Strength Index is a custom indicator that adapts the RSI calculation to measure the momentum of volatility, offering a unique view on market dynamics by showing how rapidly volatility is increasing or decreasing.

Cointegration Buy and Sell Signals [EdgeTerminal]The Cointegration Buy And Sell Signals is a sophisticated technical analysis tool to spot high-probability market turning points — before they fully develop on price charts.
Most reversal indicators rely on raw price action, visual patterns, or basic and common indicator logic — which often suffer in noisy or trending markets. In most cases, they lag behind the actual change in trend and provide useless and late signals.
This indicator is rooted in advanced concepts from statistical arbitrage, mean reversion theory, and quantitative finance, and it packages these ideas in a user-friendly visual format that works on any timeframe and asset class.
It does this by analyzing how the short-term and long-term EMAs behave relative to each other — and uses statistical filters like Z-score, correlation, volatility normalization, and stationarity tests to issue highly selective Buy and Sell signals.
This tool provides statistical confirmation of trend exhaustion, allowing you to trade mean-reverting setups. It fades overextended moves and uses signal stacking to reduce false entries. The entire indicator is based on a very interesting mathematically grounded model which I will get into down below.
Here’s how the indicator works at a high level:
EMAs as Anchors: It starts with two Exponential Moving Averages (EMAs) — one short-term and one long-term — to track market direction.
Statistical Spread (Regression Residuals): It performs a rolling linear regression between the short and long EMA. Instead of using the raw difference (short - long), it calculates the regression residual, which better models their natural relationship.
Normalize the Spread: The spread is divided by historical price volatility (ATR) to make it scale-invariant. This ensures the indicator works on low-priced stocks, high-priced indices, and crypto alike.
Z-Score: It computes a Z-score of the normalized spread to measure how “extreme” the current deviation is from its historical average.
Dynamic Thresholds: Unlike most tools that use fixed thresholds (like Z = ±2), this one calculates dynamic thresholds using historical percentiles (e.g., top 10% and bottom 10%) so that it adapts to the asset's current behavior to reduce false signals based on market’s extreme volatility at a certain time.
Z-Score Momentum: It tracks the direction of the Z-score — if Z is extreme but still moving away from zero, it's too early. It waits for reversion to start (Z momentum flips).
Correlation Check: Uses a rolling Pearson correlation to confirm the two EMAs are still statistically related. If they diverge (low correlation), no signal is shown.
Stationarity Filter (ADF-like): Uses the volatility of the regression residual to determine if the spread is stationary (mean-reverting) — a key concept in cointegration and statistical arbitrage. It’s not possible to build an exact ADF filter in Pine Script so we used the next best thing.
Signal Control: Prevents noisy charts and overtrading by ensuring no back-to-back buy or sell signals. Each signal must alternate and respect a cooldown period so you won’t be overwhelmed and won’t get a messy chart.
Important Notes to Remember:
The whole idea behind this indicator is to try to use some stat arb models to detect shifting patterns faster than they appear on common indicators, so in some cases, some assumptions are made based on historic values.
This means that in some cases, the indicator can “jump” into the conclusion too quickly. Although we try to eliminate this by using stationary filters, correlation checks, and Z-score momentum detection, there is still a chance some signals that are generated can be too early, in the stock market, that's the same as being incorrect. So make sure to use this with other indicators to confirm the movement.
How To Use The Indicator:
You can use the indicator as a standalone reversal system, as a filter for overbought and oversold setups, in combination with other trend indicators and as a part of a signal stack with other common indicators for divergence spotting and fade trades.
The indicator produces simple buy and sell signals when all criteria is met. Based on our own testing, we recommend treating these signals as standalone and independent from each other . Meaning that if you take position after a buy signal, don’t wait for a sell signal to appear to exit the trade and vice versa.
This is why we recommend using this indicator with other advanced or even simple indicators as an early confirmation tool.
The Display Table:
The floating diagnostic table in the top-right corner of the chart is a key part of this indicator. It's a live statistical dashboard that helps you understand why a signal is (or isn’t) being triggered, and whether the market conditions are lining up for a potential reversal.
1. Z-Score
What it shows: The current Z-score value of the volatility-normalized spread between the short EMA and the regression line of the long EMA.
Why it matters: Z-score tells you how statistically extreme the current relationship is. A Z-score of:
0 = perfectly average
> +2 = very overbought
< -2 = very oversold
How to use it: Look for Z-score reaching extreme highs or lows (beyond dynamic thresholds). Watch for it to start reversing direction, especially when paired with green table rows (see below)
2. Z-Score Momentum
What it shows: The rate of change (ROC) of the Z-score:
Zmomentum=Zt − Zt − 1
Why it matters: This tells you if the Z-score is still stretching out (e.g., getting more overbought/oversold), or reverting back toward the mean.
How to use it: A positive Z-momentum after a very low Z-score = potential bullish reversal A negative Z-momentum after a very high Z-score = potential bearish reversal. Avoid signals when momentum is still pushing deeper into extremes
3. Correlation
What it shows: The rolling Pearson correlation coefficient between the short EMA and long EMA.
Why it matters: High correlation (closer to +1) means the EMAs are still statistically connected — a key requirement for cointegration or mean reversion to be valid.
How to use it: Look for correlation > 0.7 for reliable signals. If correlation drops below 0.5, ignore the Z-score — the EMAs aren’t moving together anymore
4. Stationary
What it shows: A simplified "Yes" or "No" answer to the question:
“Is the spread statistically stable (stationary) and mean-reverting right now?”
Why it matters: Mean reversion strategies only work when the spread is stationary — that is, when the distance between EMAs behaves like a rubber band, not a drifting cloud.
How to use it: A "Yes" means the indicator sees a consistent, stable spread — good for trading. "No" means the market is too volatile, disjointed, or chaotic for reliable mean reversion. Wait for this to flip to "Yes" before trusting signals
5. Last Signal
What it shows: The last signal issued by the system — either "Buy", "Sell", or "None"
Why it matters: Helps avoid confusion and repeated entries. Signals only alternate — you won’t get another Buy until a Sell happens, and vice versa.
How to use it: If the last signal was a "Buy", and you’re watching for a Sell, don’t act on more bullish signals. Great for systems where you only want one position open at a time
6. Bars Since Signal
What it shows: How many bars (candles) have passed since the last Buy or Sell signal.
Why it matters: Gives you context for how long the current condition has persisted
How to use it: If it says 1 or 2, a signal just happened — avoid jumping in late. If it’s been 10+ bars, a new opportunity might be brewing soon. You can use this to time exits if you want to fade a recent signal manually
Indicator Settings:
Short EMA: Sets the short-term EMA period. The smaller the number, the more reactive and more signals you get.
Long EMA: Sets the slow EMA period. The larger this number is, the smoother baseline, and more reliable trend bases are generated.
Z-Score Lookback: The period or bars used for mean & std deviation of spread between short and long EMAs. Larger values result in smoother signals with fewer false positives.
Volatility Window: This value normalizes the spread by historical volatility. This allows you to prevent scale distortion, showing you a cleaner and better chart.
Correlation Lookback: How many periods or how far back to test correlation between slow and long EMAs. This filters out false positives when EMAs lose alignment.
Hurst Lookback: The multiplier to approximate stationarity. Lower leads to more sensitivity to regime change, higher produces a more stricter filtering.
Z Threshold Percentile: This value sets how extreme Z-score must be to trigger a signal. For example, 90 equals only top/bottom 10% of extremes, 80 = more frequent.
Min Bars Between Signals: This hard stop prevents back-to-back signals. The idea is to avoid over-trading or whipsaws in volatile markets even when Hurst lookback and volatility window values are not enough to filter signals.
Some More Recommendations:
We recommend trying different EMA pairs (10/50, 21/100, 5/20) for different asset behaviors. You can set percentile to 85 or 80 if you want more frequent but looser signals. You can also use the Z-score reversion monitor for powerful confirmation.

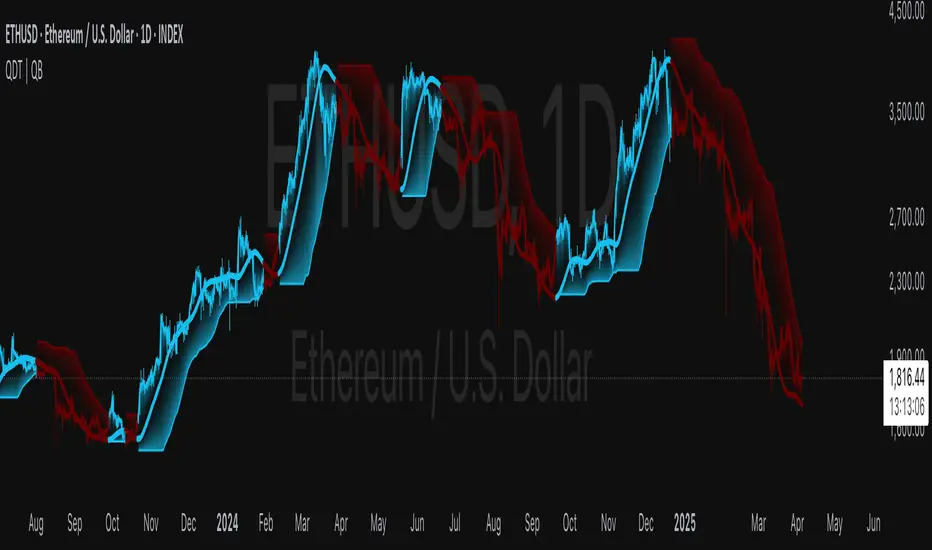
Quantile DEMA Trend | QuantEdgeB🚀 Introducing Quantile DEMA Trend (QDT) by QuantEdgeB
🛠️ Overview
Quantile DEMA Trend (QDT) is an advanced trend-following and momentum detection indicator designed to capture price trends with superior accuracy. Combining DEMA (Double Exponential Moving Average) with SuperTrend and Quantile Filtering, QDT identifies strong trends while maintaining the ability to adapt to various market conditions.
Unlike traditional trend indicators, QDT uses percentile filtering to adjust for volatility and provides dynamic thresholds, ensuring consistent signal performance across different assets and timeframes.
✨ Key Features
🔹 Trend Following with Adaptive Sensitivity
The DEMA component ensures quicker responses to price changes while reducing lag, offering a real-time reflection of market momentum.
🔹 Volatility-Adjusted Filtering
The SuperTrend logic incorporates quantile percentile filters and ATR (Average True Range) multipliers, allowing QDT to adapt to fluctuating market volatility.
🔹 Clear Signal Generation
QDT generates clear Long and Short signals using percentile thresholds, effectively identifying trend changes and market reversals.
🔹 Customizable Visual & Signal Settings
With multiple color modes and customizable settings, you can easily align the QDT indicator with your trading strategy, whether you're focused on trend-following or volatility adjustments.
📊 How It Works
1️⃣ DEMA Calculation
DEMA is used to reduce lag compared to traditional moving averages. It is calculated by applying a Double Exponential Moving Average to price data. This smoother trend-following mechanism ensures responsiveness to market movements without introducing excessive noise.
2️⃣ SuperTrend with Percentile Filtering
The SuperTrend component adapts the trend-following signal by incorporating quantile percentile filters. It identifies dynamic support and resistance levels based on historical price data:
• Upper Band: Calculated using the 75th percentile + ATR (adjusted with multiplier)
• Lower Band: Calculated using the 25th percentile - ATR (adjusted with multiplier)
These dynamic bands adjust to market conditions, filtering out noise while identifying the true direction.
3️⃣ Signal Generation
• Long Signal: Triggered when price crosses below the SuperTrend Lower Band
• Short Signal: Triggered when price crosses above the SuperTrend Upper Band
The indicator provides signals with corresponding trend direction based on these crossovers.
👁 Visual & Custom Features
• 🎨 Multiple Color Modes: Choose from "Strategy", "Solar", "Warm", "Cool", "Classic", and "Magic" color palettes to match your charting style.
• 🏷️ Long/Short Signal Labels: Optional labels for visual cueing when a long or short trend is triggered.
• 📉 Bar Color Customization: Bar colors dynamically adjust based on trend direction to visually distinguish the market bias.
👥 Who Should Use QDT?
✅ Trend Followers: Use QDT as a dynamic tool to confirm trends and capture profits in trending markets.
✅ Swing Traders: Use QDT to time entries based on confirmed breakouts or breakdowns.
✅ Volatility Traders: Identify market exhaustion or expansion points, especially during volatile periods.
✅ Systematic & Quant Traders: Integrate QDT into algorithmic strategies to enhance market detection with adaptive filtering.
⚙️ Customization & Default Settings
- DEMA Length(30): Controls the lookback period for DEMA calculation
- Percentile Length(10): Sets the lookback period for percentile filtering
- ATR Length(14): Defines the length for calculating ATR (used in SuperTrend)
- ATR Multiplier(1.2 ): Multiplier for ATR in SuperTrend calculation
- SuperTrend Length(30):Defines the length for SuperTrend calculations
📌 How to Use QDT in Trading
1️⃣ Trend-Following Strategy
✔ Enter Long positions when QDT signals a bullish breakout (price crosses below the SuperTrend lower band).
✔ Enter Short positions when QDT signals a bearish breakdown (price crosses above the SuperTrend upper band).
✔ Hold positions as long as QDT continues to provide the same direction.
2️⃣ Reversal Strategy
✔ Take profits when price reaches extreme levels (upper or lower percentile zones) that may indicate trend exhaustion or reversion.
3️⃣ Volatility-Driven Entries
✔ Use the percentile filtering to enter positions based on mean-reversion logic or breakout setups in volatile markets.
🧠 Why It Works
QDT combines the DEMA’s quick response to price changes with SuperTrend's volatility-adjusted thresholds, ensuring a responsive and adaptive indicator. The use of percentile filters and ATR multipliers helps adjust to varying market conditions, making QDT suitable for both trending and range-bound environments.
🔹 Conclusion
The Quantile DEMA Trend (QDT) by QuantEdgeB is a powerful, adaptive trend-following and momentum detection system. By integrating DEMA, SuperTrend, and quantile percentile filtering, it provides accurate and timely signals while adjusting to market volatility. Whether you are a trend follower or volatility trader, QDT offers a robust solution to identify high-probability entry and exit points.
🔹 Key Takeaways:
1️⃣ Trend Confirmation – Uses DEMA and SuperTrend for dynamic trend detection
2️⃣ Volatility Filtering – Adjusts to varying market conditions using percentile logic
3️⃣ Clear Signal Generation – Easy-to-read signals and visual cues for strategy implementation
📌 Disclaimer: Past performance is not indicative of future results. No trading strategy can guarantee success in financial markets.
📌 Strategic Advice: Always backtest, optimize, and align parameters with your trading objectives and risk tolerance before live trading.
Combined EMA Technical AnalysisThis script is written in Pine Script (version 5) for TradingView and creates a comprehensive technical analysis indicator called "Combined EMA Technical Analysis." It overlays multiple technical indicators on a price chart, including Exponential Moving Averages (EMAs), VWAP, MACD, PSAR, RSI, Bollinger Bands, ADX, and external data from the S&P 500 (SPX) and VIX indices. The script also provides visual cues through colors, shapes, and a customizable table to help traders interpret market conditions.
Here’s a breakdown of the script:
---
### **1. Purpose**
- The script combines several popular technical indicators to analyze price trends, momentum, volatility, and market sentiment.
- It uses color coding (green for bullish, red for bearish, gray/white for neutral) and a table to display key information.
---
### **2. Custom Colors**
- Defines custom RGB colors for bullish (`customGreen`), bearish (`customRed`), and neutral (`neutralGray`) signals to enhance visual clarity.
---
### **3. User Inputs**
- **EMA Colors**: Users can customize the colors of five EMAs (8, 20, 9, 21, 50 periods).
- **MACD Settings**: Adjustable short length (12), long length (26), and signal length (9).
- **RSI Settings**: Adjustable length (14).
- **Bollinger Bands Settings**: Length (20), multiplier (2), and proximity threshold (0.1% of band width).
- **ADX Settings**: Adjustable length (14).
- **Table Settings**: Position (e.g., "Bottom Right") and text size (e.g., "Small").
---
### **4. Indicator Calculations**
#### **Exponential Moving Averages (EMAs)**
- Calculates five EMAs: 8, 20, 9, 21, and 50 periods based on the closing price.
- Used to identify short-term and long-term trends.
#### **Volume Weighted Average Price (VWAP)**
- Resets daily and calculates the average price weighted by volume.
- Color-coded: green if price > VWAP (bullish), red if price < VWAP (bearish), white if neutral.
#### **MACD (Moving Average Convergence Divergence)**
- Uses short (12) and long (26) EMAs to compute the MACD line, with a 9-period signal line.
- Displays "Bullish" (green) if MACD > signal, "Bearish" (red) if MACD < signal.
#### **Parabolic SAR (PSAR)**
- Calculated with acceleration factors (start: 0.02, increment: 0.02, max: 0.2).
- Indicates trend direction: green if price > PSAR (bullish), red if price < PSAR (bearish).
#### **Relative Strength Index (RSI)**
- Measures momentum over 14 periods.
- Highlighted in green if > 70 (overbought), red if < 30 (oversold), white otherwise.
#### **Bollinger Bands (BB)**
- Uses a 20-period SMA with a 2-standard-deviation multiplier.
- Color-coded based on price position:
- Green: Above upper band or close to it.
- Red: Below lower band or close to it.
- Gray: Neutral (within bands).
#### **Average Directional Index (ADX)**
- Manually calculates ADX to measure trend strength:
- Strong trend: ADX > 25.
- Very strong trend: ADX > 50.
- Direction: Bullish if +DI > -DI, bearish if -DI > +DI.
#### **EMA Crosses**
- Detects bullish (crossover) and bearish (crossunder) events for:
- EMA 9 vs. EMA 21.
- EMA 8 vs. EMA 20.
- Visualized with green (bullish) or red (bearish) circles.
#### **SPX and VIX Data**
- Fetches daily closing prices for the S&P 500 (SPX) and VIX (volatility index).
- SPX trend: Bullish if EMA 9 > EMA 21, bearish if EMA 9 < EMA 21.
- VIX levels: High (> 25, fear), Low (< 15, stability).
- VIX color: Green if SPX bullish and VIX low, red if SPX bearish and VIX high, white otherwise.
---
### **5. Visual Outputs**
#### **Plots**
- EMAs, VWAP, and PSAR are plotted on the chart with their respective colors.
- EMA crosses are marked with circles (green for bullish, red for bearish).
#### **Table**
- Displays a summary of indicators in a customizable position and size.
- Indicators shown (if enabled):
- EMA 8/20, 9/21, 50: Green dot if bullish, red if bearish.
- VWAP: Green if price > VWAP, red if price < VWAP.
- MACD: Green if bullish, red if bearish.
- MACD Zero: Green if MACD > 0, red if MACD < 0.
- PSAR: Green if price > PSAR, red if price < PSAR.
- ADX: Arrows for very strong trends (↑/↓), dots for weaker trends, colored by direction.
- Bollinger Bands: Arrows (↑/↓) or dots based on price position.
- RSI: Numeric value, colored by overbought/oversold levels.
- VIX: Numeric value, colored based on SPX trend and VIX level.
---
### **6. Alerts**
- Triggers alerts for EMA 8/20 crosses:
- Bullish: "EMA 8/20 Bullish Cross on Candle Close!"
- Bearish: "EMA 8/20 Bearish Cross on Candle Close!"
---
### **7. Key Features**
- **Flexibility**: Users can toggle indicators on/off in the table and adjust parameters.
- **Visual Clarity**: Consistent use of green (bullish), red (bearish), and neutral colors.
- **Comprehensive**: Combines trend, momentum, volatility, and market sentiment indicators.
---
### **How to Use**
1. Add the script to TradingView.
2. Customize inputs (colors, lengths, table position) as needed.
3. Interpret the chart and table:
- Green signals suggest bullish conditions.
- Red signals suggest bearish conditions.
- Neutral signals indicate indecision or consolidation.
4. Set up alerts for EMA crosses to catch trend changes.
This script is ideal for traders who want a multi-indicator dashboard to monitor price action and market conditions efficiently.

MTF Moving Averages (only EMA)MTF Moving Averages (only EMA)
This script provides a Multi-Timeframe (MTF) Exponential Moving Average (EMA) indicator for traders to visualize multiple EMAs across different timeframes directly on a single chart.
The indicator dynamically calculates and plots up to four EMAs per timeframe (15-minute, 30-minute, 1-hour, and Daily) with user-defined lengths, offering valuable insight into price trends and potential entry or exit points.
Key Features:
Multiple Timeframe Support: The script allows you to view EMAs from different timeframes simultaneously. This is especially useful for traders who follow trends across different timeframes to make more informed decisions.
Customizable Lengths: For each timeframe, the lengths of the EMAs are fully customizable. You can adjust the length of up to four EMAs per timeframe to suit your strategy.
EMA Calculation: The Exponential Moving Average (EMA) is used, which gives more weight to recent prices and reacts faster to price changes compared to the simple moving average (SMA).
Timeframe Flexibility: The indicator supports the following timeframes:
15-minute: Ideal for short-term traders and scalpers.
30-minute: For intraday trading with a slightly longer perspective.
1-hour: Suitable for swing traders and those who prefer a more medium-term view.
Daily: Great for longer-term trend-following strategies.
Interactive and User-Friendly: You can toggle the visibility of each EMA on each timeframe, allowing you to choose exactly which EMAs you wish to display, depending on your trading strategy.
Color-Coded for Clarity: The script uses distinct colors for each EMA on the chart:
Blue: EMA1
Green: EMA2
Red: EMA3
Purple: EMA4
Line Width Customization: Each plotted EMA line has a customizable width for better visual clarity.
Use Case:
Traders who use multiple timeframes for analysis (e.g., those using the "multi-timeframe analysis" technique) will find this script particularly useful. For example, a trader may look at the 15-minute chart to catch short-term movements, the 30-minute chart for intraday trends, the 1-hour chart for swing positions, and the Daily chart for identifying the overarching market trend. The script enables them to view the EMAs for all these timeframes in one glance without having to manually switch between them.
By observing the relationships between EMAs across multiple timeframes, traders can gain valuable insights into market conditions such as:
Crossovers: When a shorter-term EMA crosses above or below a longer-term EMA, it can signal a potential trend reversal or continuation.
Trend Strength: Multiple EMAs in alignment across different timeframes can indicate strong trend strength.
Support and Resistance: EMAs can act as dynamic support and resistance levels, guiding traders on price action levels to watch for potential price reversals.
Instructions:
Enable/Disable EMAs: Toggle on or off the EMAs for each timeframe (15-min, 30-min, 1-hour, Daily) using the script’s settings.
Adjust EMA Lengths: Change the default lengths for each EMA to match your preferred settings for different timeframes.
Monitor Key Levels: Watch how price interacts with the plotted EMAs to spot potential trading signals based on your strategy.
This indicator is designed to enhance your multi-timeframe analysis and help make more informed, data-driven trading decisions.

BK Multiple MA, RMA, SMA, HMA, VWAP, Rolling VWAP **Indicator Description**
I’m incredibly proud to introduce my third indicator to the TradingView community: **BK Multiple MA with HMA, VWAP, and Rolling VWAP**! This tool has been a game-changer in my trading strategy, and I’m excited to share it with others who are navigating the markets.
This indicator holds a special place in my heart because it represents the first technical analysis concept introduced to me by my mentor when I began apprenticing under him. His wisdom, guidance, and passion for trading—and for life—left an indelible mark on my journey. I dedicate this work, and every indicator I introduce, to the foundation he helped me build, while giving glory first and foremost to God.
**Moving Averages (MAs)** are one of the most widely used tools in technical analysis, and this indicator takes them to the next level. It allows you to plot **six fully customizable moving averages simultaneously**, with options including:
- **Exponential Moving Average (EMA)**
- **Simple Moving Average (SMA)**
- **Relative Moving Average (RMA)**
- **Hull Moving Average (HMA)**
- **Volume Weighted Average Price (VWAP)**
- **Rolling VWAP**
This flexibility makes the indicator highly versatile, whether you’re a day trader, swing trader, or long-term investor. By customizing periods, colors, and line widths for each MA, you can tailor the indicator to perfectly suit your trading style.
**Key Features**
1. **Six Fully Customizable MAs**:
- Adjust periods, line colors, and widths to match your preferences.
- Select from EMA, SMA, RMA, HMA, VWAP, or Rolling VWAP for each line.
2. **Unique Rolling VWAP Option**:
- Rolling VWAP calculates the volume-weighted average price over a user-defined period, such as 200 candles.
- This feature is ideal for traders seeking volume-weighted levels that don’t reset with each session, making it invaluable for trend-following and swing trading.
3. **HMA for Smoother Trends**:
- The Hull Moving Average (HMA) is designed to reduce lag and provide a responsive, noise-free view of price trends.
- It’s a powerful tool for spotting reversals and confirming directional momentum.
4. **Session VWAP**:
- Traditional VWAP resets with each trading session, making it a reliable benchmark for intraday support and resistance levels.
**How It Works**
- **VWAP**: Reflects the average price weighted by volume for the current trading session, commonly used by institutional traders to identify key price levels.
- **Rolling VWAP**: Extends VWAP functionality by calculating over a user-defined period, allowing for flexible multi-timeframe analysis.
- **HMA**: A fast, smooth moving average that reacts quickly to price changes while filtering out noise.
The combination of these options provides traders with a comprehensive view of market dynamics, enabling better decision-making.
**Final Thoughts**
This indicator is deeply meaningful to me because it represents the first concept my mentor introduced when I began apprenticing under him. His wisdom, guidance, and passion for trading—and for life—left an indelible mark on my journey. I dedicate this work, and every indicator I introduce, to the foundation he helped me build, while giving glory first and foremost to God.
If this indicator helps you succeed, I humbly ask that you honor the blessings in your life by giving back—whether through acts of kindness, philanthropy, or helping others in need.
May the Almighty guide us all toward wisdom and success in our endeavors. All glory belongs to God!
Buy Signal Forex & Crypto v0 ImprovedPurpose of the Script:
This script is designed to generate buy and sell signals for trading Forex and cryptocurrencies by analyzing price trends using exponential moving averages (EMAs), volatility, and volume filters. The signals are displayed as arrows on the chart.
What the Script Does
Input Settings:
The script allows the user to configure various settings, such as the lengths of EMAs, a higher timeframe for trend confirmation, and thresholds for volume and volatility (ATR - Average True Range).
Key settings:
5 EMA Length – Length of the short-term EMA.
13 EMA Length – Length of the medium-term EMA.
26 EMA Length – Length of the long-term EMA.
21 EMA Length – Used for trend confirmation on a higher timeframe.
Higher Timeframe – Lets you select a timeframe (e.g., daily) for confirming the overall trend.
ATR Threshold – Filters out signals when the market's volatility is too low.
Volume Filter – Ensures sufficient trading activity before generating signals.
Calculating EMAs (Exponential Moving Averages):
Four EMAs are calculated:
ema5 (short-term), ema13 (medium-term), ema26 (long-term), and ema21 (higher timeframe confirmation).
These EMAs help determine price trends and crossovers, which are critical for identifying buy and sell opportunities.
Trend Confirmation Using a Higher Timeframe:
The 21 EMA on the higher timeframe (e.g., daily) is used to confirm the overall direction of the market.
Defining Signal Conditions:
Buy Signal:
A buy signal is generated when:
ema5 crosses above ema13 (indicating a bullish trend).
ema5 crosses above ema26 (stronger bullish confirmation).
The closing price is above ema5, ema13, ema26, and the 21 EMA on the higher timeframe.
The market's volatility (ATR) is above the defined threshold.
The volume meets the conditions or volume filtering is disabled.
Sell Signal:
A sell signal is generated when:
ema5 crosses below ema13 (indicating a bearish trend).
ema5 crosses below ema26 (stronger bearish confirmation).
The closing price is below ema5, ema13, ema26, and the 21 EMA on the higher timeframe.
The market's volatility (ATR) is above the defined threshold.
The volume meets the conditions or volume filtering is disabled.
Volume Filtering:
Ensures there’s enough trading activity by comparing the current volume to a 20-period moving average of volume.
Persistent Variables:
These variables (crossed13 and crossed13Sell) help track whether the short-term EMA (ema5) has crossed the medium-term EMA (ema13). This prevents false or repeated signals.
Displaying Signals on the Chart:
Buy signals are displayed as green upward arrows below the price.
Sell signals are displayed as red downward arrows above the price.
How It Helps Traders:
This script provides visual cues for potential entry and exit points by combining moving average crossovers, volatility, volume, and higher timeframe trend confirmation. It works well for trending markets and ensures signals are filtered for stronger conditions to reduce noise.

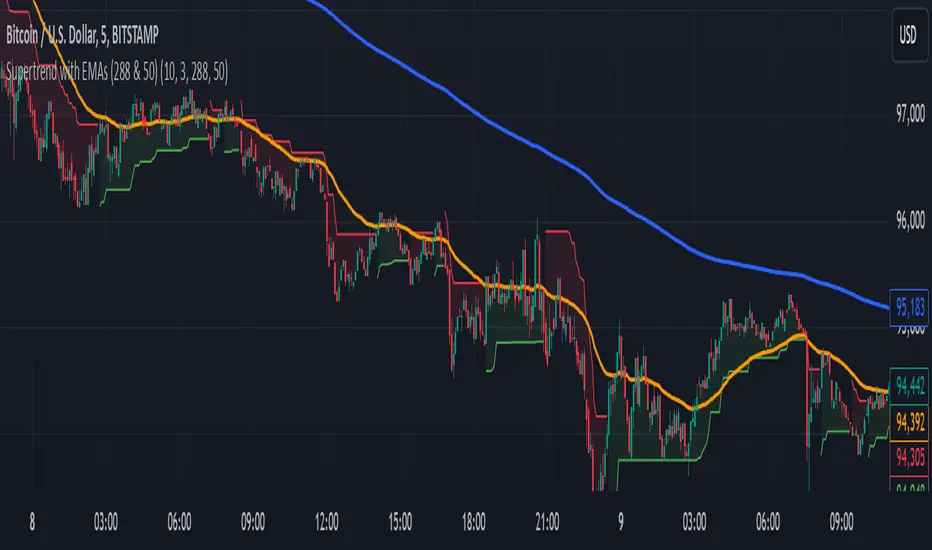
Supertrend with EMAs (288 & 50)This indicator combines the Supertrend with two key Exponential Moving Averages (EMAs) — the 50 EMA and the 288 EMA — to help traders identify trends and possible entry or exit points in the market.
Key Features:
Supertrend Indicator:
The Supertrend indicator is a widely used trend-following tool. It helps determine whether the market is in an uptrend or downtrend by adjusting based on the Average True Range (ATR).
In this indicator, green represents an uptrend, and red represents a downtrend.
288 EMA:
The 288-period Exponential Moving Average is plotted to show the long-term market trend. It reacts more quickly to recent price changes than a simple moving average, offering an effective way to gauge long-term market direction.
50 EMA:
The 50-period Exponential Moving Average is commonly used as a short-term trend indicator. It helps identify shorter-term trends and serves as a dynamic support/resistance level.
EMA Crossover Alerts:
This indicator includes alerts for when the 50 EMA crosses above the 288 EMA (bullish signal) and when it crosses below (bearish signal), helping traders catch trend reversals or confirmation of current trends.
Supertrend Alerts:
Alerts are triggered when the Supertrend indicator switches from uptrend to downtrend or downtrend to uptrend, indicating a potential shift in market direction.
Usage:
Uptrend Confirmation: When the Supertrend is green and the 50 EMA is above the 288 EMA, it signals that the market is in a strong bullish trend.
Downtrend Confirmation: When the Supertrend is red and the 50 EMA is below the 288 EMA, it indicates that the market is in a bearish trend.
Crossover Signals: The indicator provides alerts when the 50 EMA crosses above or below the 288 EMA, helping traders spot trend changes.
Best For:
Trend-following strategies
Identifying potential trend reversals and market shifts
Traders looking for a combination of short-term and long-term trend analysis
Note: This indicator is most effective when used in conjunction with other technical analysis tools and should be considered alongside other factors such as volume, support/resistance levels, and price action.
EMA/SMA + Multi-Timeframe Dashboard (Vertical)20/50 ema and 200 sma
The EMA SMA Trading Indicator combines the power of Exponential Moving Averages (EMA) and Simple Moving Averages (SMA) to help traders identify trends, reversals, and key entry/exit points.
Features:
Dual Moving Averages: Tracks both EMA and SMA to provide a balanced view of short-term and long-term market trends.
Customizable Periods: Allows users to set unique periods for EMA and SMA to suit their trading style and timeframe (e.g., day trading, swing trading, or investing).
Cross Alerts: Highlights EMA and SMA crossover points, which often indicate potential buy or sell signals.
Color-Coded Lines: Visual differentiation between EMA (dynamic and responsive) and SMA (smooth and lagging) for better readability.
Multi-Timeframe Compatibility: Suitable for scalping, intraday trading, and long-term analysis.
Usage:
Trend Confirmation: When the EMA is above the SMA, it signals a bullish trend; when it is below the SMA, it signals a bearish trend.
Crossover Strategy: Use crossovers as potential buy (EMA crosses above SMA) or sell (EMA crosses below SMA) signals.
Dynamic Support/Resistance: EMA can act as short-term support/resistance, while SMA represents long-term levels.
This indicator is perfect for traders who want to combine EMA's speed with SMA's stability for improved decision-making in volatile markets. Customizable alerts and visual cues make it user-friendly for beginners and experienced traders.
Make informed decisions and take your trading to the next level with the EMA SMA Trading Indicator!

StdDev of VWAP/MAStdDev Indicator (MA, Smoothed VWAP & Rolling VWAP) v5
Overview: The StdDev Indicator is a comprehensive tool designed to provide traders with multi-term deviation analysis by integrating various Moving Averages (MA) and Volume Weighted Average Price (VWAP) methodologies. This indicator combines different MA types and VWAP calculations across multiple timeframes to offer a nuanced view of market volatility and trend strength.
Key Features:
Multiple Moving Average Types:
Simple Moving Average (SMA): Calculates the average price over a specified period, providing a straightforward trend indicator.
Exponential Moving Average (EMA): Gives more weight to recent prices, making it more responsive to new information.
Weighted Moving Average (WMA): Assigns different weights to each price point, emphasizing specific periods.
Smoothed VWAP: Enhances the traditional VWAP by applying additional smoothing techniques (SMA, EMA, WMA) to reduce volatility.
Rolling VWAP: Continuously recalculates VWAP over a rolling window, offering dynamic support and resistance levels.
Multi-Term Deviation Analysis:
Extra Short Term (30 periods)
Short Term (50 periods)
Medium Term (110 periods)
Long Term (125 periods)
Extra-Long Term (190 periods)
Extremely-Long Term (245 periods)
Each term calculates the deviation of the selected price source (default: Low) from its corresponding MA or VWAP, normalized by the standard deviation. This multi-term approach allows traders to assess volatility and trend consistency across different time horizons.
Composite Upper and Lower Bounds:
Aggregates the upper and lower deviations from all terms to form composite boundaries. These bounds serve as dynamic support and resistance levels, helping traders identify potential reversal points or breakout zones.
Timeframe Customization:
Visibility Settings: Customize which deviation terms are visible on specific timeframes (15m, 1h, 4h, 1d, 1w). This flexibility ensures that the indicator aligns with your trading strategy, whether you're a scalper, day trader, or long-term investor.
Bar Coloring (Optional):
Visual Cues: When enabled, bars are color-coded based on the deviation levels, providing immediate visual feedback on market conditions. For example, bars may turn red when short-term deviations exceed the upper bound, indicating potential overbought conditions.
How It Works:
Deviation Calculation:
For each selected MA or VWAP type and term length, the indicator calculates the deviation of the current price source from the MA/VWAP. This deviation is normalized by the standard deviation to account for volatility.
Channel Offset:
Applies a linear regression and standard deviation to the deviation series to establish upper and lower channels. These channels are adjustable via multipliers, allowing traders to set their sensitivity levels.
Composite Boundaries:
Averages the upper and lower channels across all deviation terms to form composite upper and lower bounds. These bounds provide a holistic view of market volatility and trend strength.
Visualization:
Plots individual deviation lines for each term, along with the composite bounds. Optional bar coloring enhances visual interpretation, making it easier to spot significant market movements.
Usage Instructions:
Setup:
Add the StdDev Indicator to your TradingView chart. By default, it uses the Low price as the source, but this can be customized.
Configuration:
Moving Average Type: Select your preferred MA or VWAP type from the dropdown menu.
Term Lengths: Adjust the lengths for each deviation term as per your trading strategy.
StdDev Multipliers: Set the multipliers for the upper and lower bounds to control sensitivity.
Timeframe Visibility: Choose which deviation terms are visible on specific timeframes to tailor the indicator to your trading style.
Bar Coloring: Enable or disable bar coloring based on deviation thresholds for enhanced visual cues.
Interpretation:
Deviations: Monitor the deviation lines to assess overbought or oversold conditions across different terms.
Composite Bounds: Use the upper and lower bounds as dynamic support and resistance levels.
Bar Colors: Quickly identify significant market movements through color-coded bars.
Why Choose StdDev Indicator?
Comprehensive Analysis: By integrating multiple MA and VWAP types across various terms, the indicator offers a multifaceted view of market conditions.
Customization: Highly configurable settings allow traders to adapt the indicator to their specific strategies and timeframes.
Visual Clarity: Clear plotting and optional bar coloring provide intuitive insights, reducing the need for complex analysis.
Conclusion: The StdDev Indicator (MA, Smoothed VWAP & Rolling VWAP) v5 is a versatile tool that combines advanced moving average and VWAP methodologies to deliver a robust deviation analysis framework. Whether you're looking to fine-tune your scalping strategy or gain a deeper understanding of long-term market trends, this indicator equips you with the necessary tools to make informed trading decisions.
Support & Feedback: If you have any questions or need assistance with the indicator, feel free to reach out through the TradingView community or contact the script author directly.
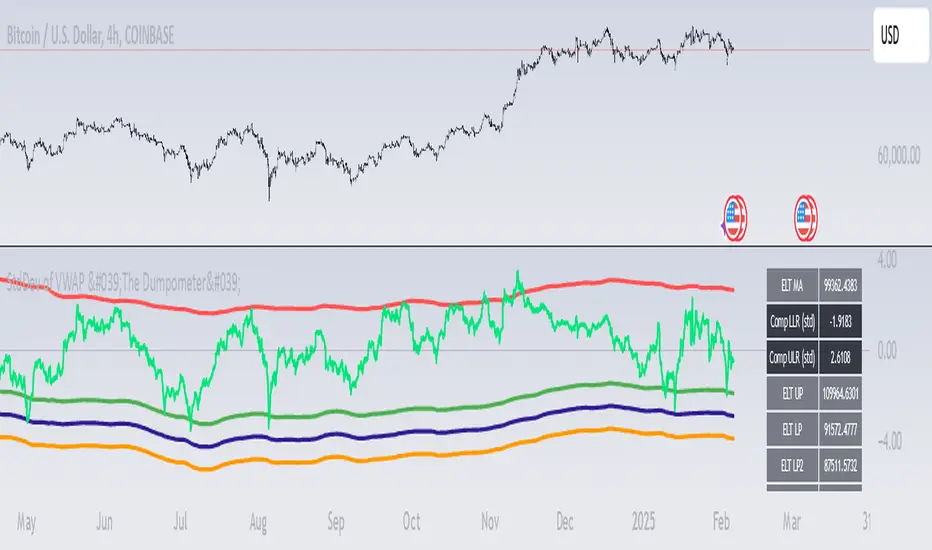
MA Trend DashboardMA Trend Dashboard - Features
The MA Trend Dashboard is a versatile and user-friendly indicator designed to provide a comprehensive overview of market trends across multiple timeframes using moving averages (MAs). Here's what this script offers:
1. Dashboard Display
A compact and visually appealing dashboard is overlaid on the chart.
The dashboard displays the trend direction and deviation percentages for 30-minute, 1-hour, and 4-hour timeframes.
Users can position the dashboard in different locations (Top Right, Middle Right, or Bottom Right) and customize the text size (Tiny, Small, Normal).
2. Multi-Timeframe Trend Analysis
The script uses the concept of Multi-Timeframe (MTF) analysis to assess trends across:
30-minute (30m)
1-hour (1h)
4-hour (4h)
Each timeframe's trend is evaluated using the selected moving average method.
3. Customizable Moving Average Methods
Users can choose from various moving average calculation methods:
SMA (Simple Moving Average)
EMA (Exponential Moving Average)
SMMA (Smoothed Moving Average or RMA)
WMA (Weighted Moving Average)
VWMA (Volume-Weighted Moving Average)
This flexibility allows for tailored trend analysis based on the user's preferred methodology.
4. Visual Trend Indicators
Clear visual cues indicate the trend direction for each timeframe:
↑ (Up): Bullish trend.
↓ (Down): Bearish trend.
↘ (Weak Up): Mild bullishness.
↗ (Weak Down): Mild bearishness.
The background color of each cell dynamically changes based on the trend:
Green: Uptrend.
Red: Downtrend.
5. Deviation Percentage
The dashboard includes the percentage difference between the current price and the moving average for each timeframe.
Positive percentages are highlighted in green, and negative percentages in red.
6. Customization Options
Text Color: Allows users to adjust the color of the text displayed in the dashboard.
MA Length: Users can set the period for the moving averages (default is 50).
7. Dynamic Requests
Utilizes TradingView's dynamic_requests feature to ensure accurate real-time data across different timeframes without cluttering the chart.
Usage
This indicator is ideal for traders who want a quick and reliable snapshot of market trends across multiple timeframes. It is particularly suited for intraday and swing trading strategies, offering insights into price momentum and potential reversals.

MACD Pseudo Super Smoother [MACDPSS]The MACD Pseudo Super Smoother (MACDPSS) is a variation of the classic Moving Average Convergence Divergence (MACD) indicator. It utilizes the Pseudo Super Smoother (PSS) filter, a Finite Impulse Response (FIR) filter, to smooth both the MACD line and the signal line, providing a potentially refined representation of momentum compared to the traditional MACD which typically uses Exponential Moving Averages (EMAs).
The PSS, inspired by the Super Smoother filter (an Infinite Impulse Response (IIR) filter), aims to reduce noise while minimizing lag. The MACDPSS leverages this FIR implementation to create a unique MACD variant. The core concept of MACD, which involves analyzing the relationship between two moving averages of different lengths to identify momentum shifts, remains intact.
Filter Types and Customization
The MACDPSS offers independent control over the smoothing applied to the MACD line and the signal line through two "Filter Style" inputs:
Oscillator MA Type: This setting determines the filter type used to calculate the fast and slow moving averages that form the basis of the MACD line.
Signal Line MA Type: This setting controls the filter type used to smooth the MACD line, generating the signal line.
Each of these settings allows a choice between two distinct PSS filter types:
Type 1: Provides a smoother output with a more gradual response, characterized by greater attenuation of high-frequency components.
Type 2: Exhibits increased reactivity, allowing for a faster response to shifts in momentum, but with a potential for overshoot.
This dual-filter approach provides flexibility in tailoring the indicator's responsiveness and smoothness to individual preferences and specific market conditions. The user can, for example, choose a smoother Type 1 filter for the MACD line and a more reactive Type 2 filter for the signal line, or vice-versa.
Calculations
The MACDPSS calculates the MACD line by subtracting the slow moving average from the fast moving average, both derived using the PSS filter with the selected "Oscillator MA Type." The signal line is then calculated by applying the PSS filter with the selected "Signal Line MA Type" to the MACD line. The histogram represents the difference between the MACD line and the signal line.
Interpretation
The interpretation of the MACDPSS is similar to the standard MACD. Crossovers between the MACD line and the signal line, the position of the MACD line relative to the zero line, and the slope and direction of the histogram are all used to gauge momentum and potential trend changes.
Disclaimer
The MACDPSS, while inspired by the Super Smoother, utilizes a distinct FIR approximation (the PSS). Therefore, its behavior will not perfectly mirror that of a MACD calculated using IIR filters. The PSS is designed to be a rough approximation. This indicator should be used in conjunction with other technical analysis tools, and users should be aware of the inherent differences between FIR and IIR filter characteristics when interpreting the indicator's signals. Like any moving average based indicator, the MACDPSS is a lagging indicator, although it tries to improve it. The novelty of this indicator comes from applying a unique FIR filter to a classic momentum oscillator in a configurable way.
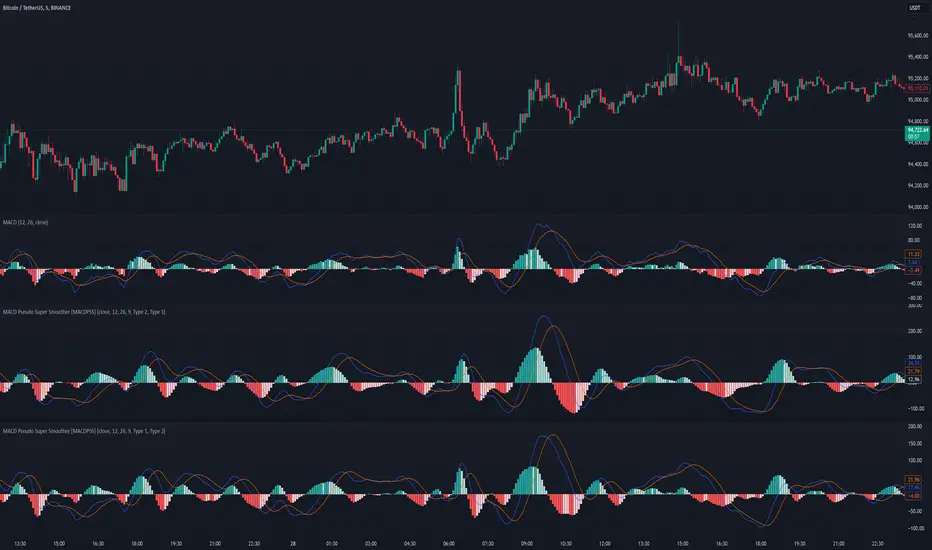
Enhanced SMA Signal Box With TargetsEnhanced SMA Signal Box With Targets
The Enhanced SMA Signal Box With Targets indicator is a versatile tool designed to help traders identify buy and sell signals based on various technical analysis methods, including Simple Moving Averages (SMA), Exponential Moving Averages (EMA), and Average True Range (ATR). This indicator provides clear visual signals and target levels to assist traders in making informed decisions.
Key Features
Simple Moving Averages (SMA):
20 SMA: Represents short-term price trends.
50 SMA: Represents long-term price trends.
Exponential Moving Average (EMA):
50 EMA: Adds additional trend confirmation to the SMA.
Signal Visualization:
Buy Signals: Displayed with a green "🚀" emoji below the candle when the closing price crosses above the 20 SMA.
Sell Signals: Displayed with a red "💣" emoji above the candle when the closing price crosses below the 20 SMA.
Yellow Box: Highlights the signal candle, making it easy to identify the most recent and historical signals.
Target Prices:
First Target: Based on the size of the signal candle.
Second and Third Targets: Calculated using the ATR multiplied by a user-defined factor to help set profit-taking levels.
Customizable Filters:
MACD Filter: Users can enable this filter to use MACD line crossings for signal confirmation.
Higher Timeframe SMA Filter: Users can set a higher timeframe SMA to filter signals based on the long-term trend.
Volume Filter: Users can set a minimum volume threshold for signals.
Alerts:
Users can enable alerts for buy and sell signals, ensuring they never miss a trading opportunity.
Customizable Settings:
Line Colors and Thickness: Users can adjust the colors and thickness of the SMAs, EMA, and signal boxes.
Signal Emojis: Users can choose custom emojis for buy and sell signals.
How It Works
Trend Calculation: The indicator calculates short-term and long-term trends using the 20 SMA, 50 SMA, and 50 EMA.
Signal Generation: Buy and sell signals are generated when the price crosses the 20 SMA, with optional confirmation from MACD and volume filters.
Target Calculation: Profit targets are based on the size of the signal candle and ATR, helping traders set realistic profit-taking levels.
Important Notice
This indicator is designed for educational purposes and should not be considered as financial advice. Past performance does not guarantee future results. Users should conduct their own research and analysis before making any trading decisions. Trading involves substantial risk and is not suitable for every investor. Always consider your financial situation, investment objectives, and risk tolerance before trading. Please ensure you comply with all the relevant regulations and TradingView's house rules while using this indicator.

MULTI TF SCANNERMulti-Timeframe Moving Average Scanner Script
This script is designed to scan multiple timeframes for specific moving average (MA) crossovers to help traders identify potential buy or sell signals. The moving averages, such as the Simple Moving Average (SMA) or Exponential Moving Average (EMA), are calculated for different timeframes, allowing the script to provide a comprehensive analysis of the market trend.
Features:
Multiple Timeframe Analysis:
The script scans across various timeframes, including 5 minutes, 15 minutes, 1 hour, 4 hours, 1 day, and 1 week.
The moving averages are calculated for each of these timeframes, enabling the trader to gauge trends across short, medium, and long-term periods.
MA Crossover Detection:
The script checks for crossovers between a fast-moving average (e.g., 9-period) and a slow-moving average (e.g., 50-period).
A bullish crossover (fast MA crossing above slow MA) signals a potential buy, while a bearish crossover (fast MA crossing below slow MA) signals a potential sell.
Recursive Timeframe Check:
Before generating a buy or sell signal, the script checks for confirmations from higher timeframes.
Signals are only generated when the crossovers align across multiple timeframes (e.g., a buy signal on the 5-minute chart is confirmed by a bullish crossover on the 1-hour and 4-hour charts).
Signal Quality Indicator:
The script assigns a quality score to each signal based on how many higher timeframes confirm the crossover.
A stronger confirmation across multiple timeframes increases the quality of the signal, which can be visualized on the chart.
Optimized for Performance:
The calculations for moving average crossovers are designed to minimize unnecessary recalculations, optimizing the script’s performance and reducing lag.
The multi-timeframe checks are done only when the moving average crossover occurs or changes, ensuring efficiency.
User-Friendly Interface:
The results are displayed on the chart with clear visual cues to indicate the buy/sell signals and signal strength.
The script is minimalistic, with an uncluttered interface, providing the user with only the most relevant information for making trading decisions.
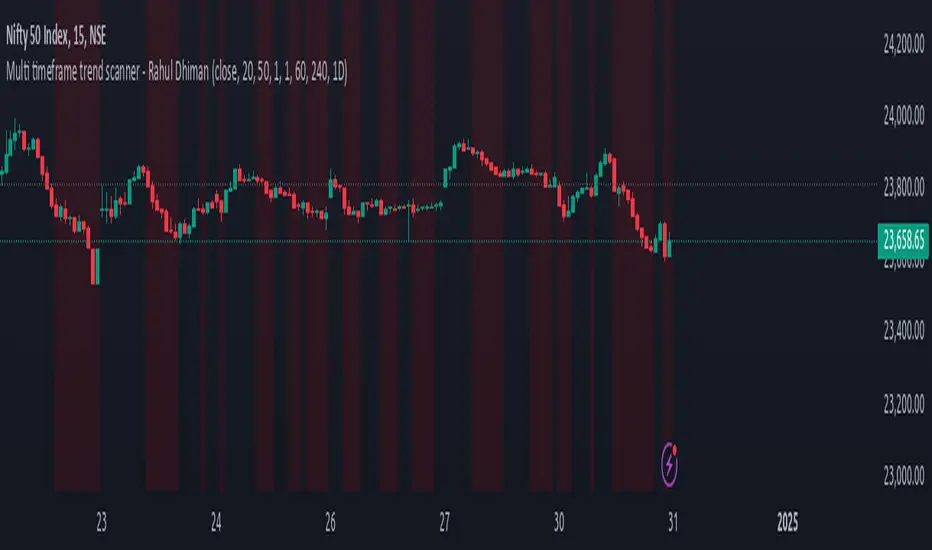
BTC InsightThis script is a comprehensive tool for analyzing Bitcoin's daily price range, trend predictions, and significant volume-based order block levels. It combines multiple technical analysis concepts, including exponential moving averages (EMAs), logarithmic calculations, and custom indicators for advanced forecasting and visualization.
Key Features and Technical Details
1. Exponential Moving Averages (EMAs)
The script calculates two smoothed EMAs:
EMA1 and EMA2 are derived from the logarithmic price of Bitcoin (log(close)).
The smoothing periods and multipliers are user-configurable through inputs:
Smoothed EMA1 Period (default: 728)
Smoothed EMA2 Period (default: 728)
Initial EMA Multipliers (default: 1.0 for EMA1, 5.0 for EMA2)
A time decay factor is applied to the multipliers to adjust sensitivity over time, making the EMAs adaptive to market dynamics.
2. Logarithmic Domain Calculations
The script uses logarithmic transformations to enhance accuracy when dealing with large price changes.
Adjustments to EMAs are made in the logarithmic domain and converted back to the price domain for plotting.
3. EMA Forecasting
The script performs a linear regression analysis over a specified period (728 bars by default) to estimate future price trends for both EMAs.
Slope Adjustments:
RSI (Relative Strength Index) is incorporated to modify the forecast slope dynamically:
RSI > 70: Bearish adjustment (-0.5)
RSI < 30: Bullish adjustment (+0.5)
Forecasts are plotted as dashed lines, projecting future values of EMA1 (green) and EMA2 (red).
4. Order Block Detection
Detects order block levels based on high volume spikes relative to the average volume over a lookback period (default: 100 bars).
A volume multiplier (default: 1.5x) is applied to identify significant volume activity.
Two types of order blocks are identified:
Below EMA1: A price zone where significant buying occurred below EMA1.
Above EMA2: A price zone where significant selling occurred above EMA2.
Order blocks are visualized as shaded rectangles:
Green boxes represent order blocks below EMA1.
Red boxes represent order blocks above EMA2.
5. Customization Inputs
The script allows fine-tuning via the following parameters:
EMA Settings: Periods, multipliers, and time factors for both EMAs.
Volume Analysis Settings: Lookback period and volume multiplier for order block detection.
Order Block Box Settings: Height of the range as a percentage of the detected price.
6. Visualization
EMAs: Two smoothed exponential moving averages are plotted with configurable offsets.
Forecast Lines: Dashed lines project future EMA trends based on regression analysis.
Order Block Boxes: Highlight areas of high volume below EMA1 and above EMA2, indicating potential support or resistance zones.
How It Works in Practice
EMAs and Trend Analysis:
The EMAs represent long-term market trends, adjusted dynamically using custom multipliers and time decay.
The script forecasts the EMAs' future trajectories to anticipate potential price movements.
Order Blocks:
High-volume zones indicate areas where significant market activity occurred, providing insights into potential price reversal points or continuation zones.
RSI Integration:
RSI-based slope adjustment fine-tunes the EMA forecast, adding an extra layer of dynamic market context.
Comprehensive View:
By combining trend forecasts with volume-based zones, the script delivers a robust analysis tool for identifying potential entry/exit points, support/resistance levels, and long-term trend predictions.
GoldenTradz EMA+SMA Insight Multi Timeframe - [TilakBala]GoldenTradz EMA+SMA Insight Multi-Timeframe
📊 Indicator By: TilakBala from GoldenTradz — Revolutionize your trading approach with precision and insight!
Unlock the full potential of moving averages with the GoldenTradz EMA+SMA Insight indicator. This feature-packed tool combines the strength of Exponential Moving Averages (EMA) and Simple Moving Averages (SMA), offering unmatched flexibility and clarity for traders. Whether you're a beginner or a pro, this indicator empowers you to make well-informed trading decisions across multiple timeframes.
Key Features & Advantages:
Multi-Timeframe Analysis: Seamlessly analyze market trends using EMAs and SMAs from different timeframes on a single chart.
Gain a broader perspective by comparing short-term and long-term trends.
Customizable Settings:
Adjust EMA and SMA lengths, sources, and timeframes to fit your trading strategy perfectly.
Enable or disable specific moving averages for a clutter-free chart view.
Enhanced Trend Detection:
Identify bullish and bearish trends quickly using visually distinct EMAs and SMAs.
Use shorter EMAs for faster signals and longer SMAs for reliable trend confirmation.
Overlay Design:
Plots moving averages directly on the price chart for effortless analysis.
Distinct colors and line thicknesses ensure clear identification of each moving average.
Versatile Applications:
Suitable for scalping, day trading, swing trading, and long-term investments.
Works flawlessly with stocks, forex, cryptocurrencies, commodities, indices, and more.
Decision-Making Support:
Crossovers between EMAs and SMAs help identify potential buy or sell opportunities.
Monitor key support and resistance levels dynamically.
Efficiency in Market Noise:
EMAs provide rapid responsiveness in volatile markets.
SMAs help smooth out market noise for clearer long-term trends.
Adaptable to Any Strategy:
Perfect for breakout, trend-following, and mean-reversion strategies.
Combine with other indicators for a comprehensive trading system.
User-Friendly:
Intuitive interface with clear input fields for quick setup.
Suitable for traders of all experience levels.
📊 Indicator By: TilakBala from GoldenTradz — Revolutionize your trading approach with precision and insight!
Transform your trading with GoldenTradz EMA+SMA Insight — the ultimate tool for trend and momentum analysis.

Multifactor Buy/Sell Strategy V2 | RSI, MACD, ATR, EMA, Boll.BITGET:1INCHUSDT
This Pine Script code for TradingView is a multifactor Buy/Sell indicator that combines several technical factors to generate trading signals based on trend, volatility, and volume conditions. Here’s a breakdown of the main components and functionality:
Indicator Name
- Multifactor Buy/Sell Strategy V2 — an overlay indicator applied directly on the price chart.
### Input Parameters
The script includes multiple customizable parameters:
- RSI, EMA, MACD parameters — for setting periods and signals of MACD and RSI.
- ATR and Bollinger Bands — used for volatility analysis and level determination.
- Minimum Volatility Threshold — sets a minimum Bollinger Band width threshold for determining high volatility.
Core Indicators
1. RSI — calculated to identify oversold (below 30) and overbought (above 70) conditions.
2. EMA and MACD — calculates exponential moving averages and MACD histogram to determine trend direction.
3. ATR and Bollinger Bands — used to assess current volatility and establish dynamic upper and lower bands.
Volatility and Volume Analysis
- Determines the current ATR level and Bollinger Band width to evaluate high volatility.
- Calculates the volume moving average to track periods of increased volume during high volatility.
Trend Analysis
The script uses the difference between fast and slow EMAs to define strong trends:
- Uptrend — when the fast EMA is above the slow EMA, the price is above the fast EMA, and the trend is strong.
- Downtrend — when the fast EMA is below the slow EMA, the price is below the fast EMA, and the trend is strong.
Momentum Filter
- Based on the price change over the last three bars and compared against the minimum volatility threshold to identify strong momentum.
Buy and Sell Signal Generation
- Buy Signal: Uptrend with RSI oversold, positive MACD histogram, high volatility and volume, strong momentum, and sufficient Bollinger Band width.
- Sell Signal: Downtrend with RSI overbought, negative MACD histogram, high volatility and volume, strong momentum, and sufficient Bollinger Band width.
Visualization
- Buy and sell signals are displayed as green and red triangles on the chart.
- Plots for fast and slow EMAs, upper and lower bands, and Bollinger Bands.
Alerts
The script includes alert conditions for buy and sell signals, allowing notifications to be sent via email or mobile app.
Information Panel
A small table on the chart displays current volatility dataThis Pine Script code for TradingView is a multifactor Buy/Sell indicator that combines several technical factors to generate trading signals based on trend, volatility, and volume conditions. Here’s a breakdown of the main components and functionality:
Indicator Name
- Multifactor Buy/Sell Strategy V2 — an overlay indicator applied directly on the price chart.
Input Parameters
The script includes multiple customizable parameters:
- **RSI, EMA, MACD parameters** — for setting periods and signals of MACD and RSI.
- **ATR and Bollinger Bands** — used for volatility analysis and level determination.
- **Minimum Volatility Threshold** — sets a minimum Bollinger Band width threshold for determining high volatility.
Core Indicators
1. RSI — calculated to identify oversold (below 30) and overbought (above 70) conditions.
2. EMA and MACD — calculates exponential moving averages and MACD histogram to determine trend direction.
3. ATR and Bollinger Bands — used to assess current volatility and establish dynamic upper and lower bands.
Volatility and Volume Analysis
- Determines the current ATR level and Bollinger Band width to evaluate high volatility.
- Calculates the volume moving average to track periods of increased volume during high volatility.
Trend Analysis
The script uses the difference between fast and slow EMAs to define strong trends:
- Uptrend — when the fast EMA is above the slow EMA, the price is above the fast EMA, and the trend is strong.
- Downtrend — when the fast EMA is below the slow EMA, the price is below the fast EMA, and the trend is strong.
Momentum Filter
- Based on the price change over the last three bars and compared against the minimum volatility threshold to identify strong momentum.
Buy and Sell Signal Generation
- Buy Signal: Uptrend with RSI oversold, positive MACD histogram, high volatility and volume, strong momentum, and sufficient Bollinger Band width.
- Sell Signal: Downtrend with RSI overbought, negative MACD histogram, high volatility and volume, strong momentum, and sufficient Bollinger Band width.
Visualization
- Buy and sell signals are displayed as green and red triangles on the chart.
- Plots for fast and slow EMAs, upper and lower bands, and Bollinger Bands.
Alerts
The script includes alert conditions for buy and sell signals, allowing notifications to be sent via email or mobile app.
Information Panel
A small table on the chart displays current volatility
- Volatility Status — indicates high or low volatility.
- Bollinger Band Width — current width as a percentage.
- ATR Ratio — ratio of current ATR to long-term average ATR.
This script is suitable for trading in high-volatility conditions, combining multiple filters and factors to generate precise buy and sell signals.

Composite Oscillation Indicator Based on MACD and OthersThis indicator combines various technical analysis tools to create a composite oscillator that aims to capture multiple aspects of market behavior. Here's a breakdown of its components:
* Individual RSIs (xxoo1-xxoo15): The code calculates the RSI (Relative Strength Index) of numerous indicators, including volume-based indicators (NVI, PVI, OBV, etc.), price-based indicators (CCI, CMO, etc.), and moving averages (WMA, ALMA, etc.). It also includes the RSI of the MACD histogram (xxoo14).
* Composite RSI (xxoojht): The individual RSIs are then averaged to create a composite RSI, aiming to provide a more comprehensive view of market momentum and potential turning points.
* MACD Line RSI (xxoo14): The RSI of the MACD histogram incorporates the momentum aspect of the MACD indicator into the composite measure.
* Double EMA (co, coo): The code employs two Exponential Moving Averages (EMAs) of the composite RSI, with different lengths (9 and 18 periods).
* Difference (jo): The difference between the two EMAs (co and coo) is calculated, aiming to capture the rate of change in the composite RSI.
* Smoothed Difference (xxp): The difference (jo) is further smoothed using another EMA (9 periods) to reduce noise and enhance the signal.
* RSI of Smoothed Difference (cco): Finally, the RSI is applied to the smoothed difference (xxp) to create the core output of the indicator.
Market Applications and Trading Strategies:
* Overbought/Oversold: The indicator's central line (plotted at 50) acts as a reference for overbought/oversold conditions. Values above 50 suggest potential overbought zones, while values below 50 indicate oversold zones.
* Crossovers and Divergences: Crossovers of the cco line above or below its previous bar's value can signal potential trend changes. Divergences between the cco line and price action can also provide insights into potential trend reversals.
* Emoji Markers: The code adds emoji markers ("" for bullish and "" for bearish) based on the crossover direction of the cco line. These can provide a quick visual indication of potential trend shifts.
* Colored Fill: The area between the composite RSI line (xxoojht) and the central line (50) is filled with color to visually represent the prevailing market sentiment (green for above 50, red for below 50).
Trading Strategies (Examples):
* Long Entry: Consider a long entry (buying) signal when the cco line crosses above its previous bar's value and the composite RSI (xxoojht) is below 50, suggesting a potential reversal from oversold conditions.
* Short Entry: Conversely, consider a short entry (selling) signal when the cco line crosses below its previous bar's value and the composite RSI (xxoojht) is above 50, suggesting a potential reversal from overbought conditions.
* Confirmation: Always combine the indicator's signals with other technical analysis tools and price action confirmation for better trade validation.
Additional Notes:
* The indicator offers a complex combination of multiple indicators. Consider testing and optimizing the parameters (EMAs, RSI periods) to suit your trading style and market conditions.
* Backtesting with historical data can help assess the indicator's effectiveness and identify potential strengths and weaknesses in different market environments.
* Remember that no single indicator is perfect, and the cco indicator should be used in conjunction with other forms of analysis to make informed trading decisions.
By understanding the logic behind this composite oscillator and its potential applications, you can incorporate it into your trading strategy to potentially identify trends, gauge market sentiment, and generate trading signals.
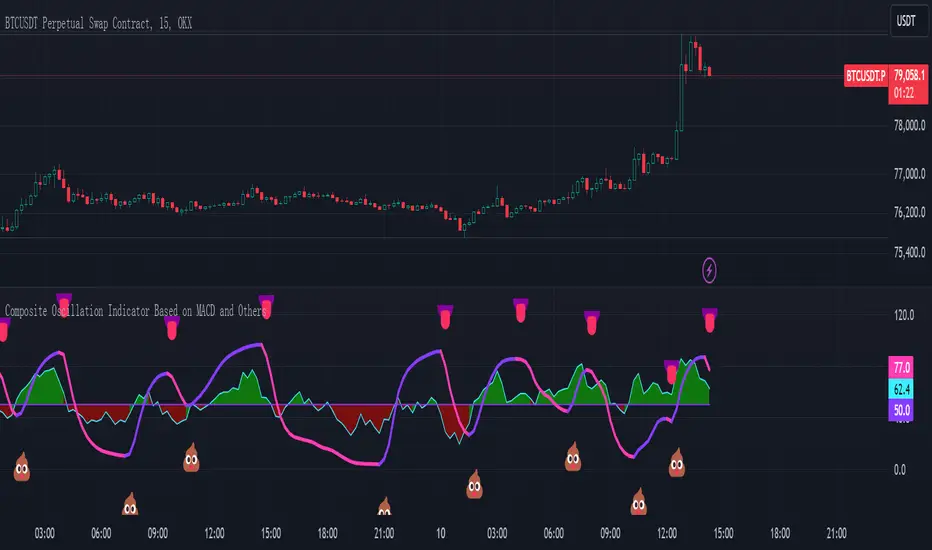
The Most Powerful TQQQ EMA Crossover Trend Trading StrategyTQQQ EMA Crossover Strategy Indicator
Meta Title: TQQQ EMA Crossover Strategy - Enhance Your Trading with Effective Signals
Meta Description: Discover the TQQQ EMA Crossover Strategy, designed to optimize trading decisions with fast and slow EMA crossovers. Learn how to effectively use this powerful indicator for better trading results.
Key Features
The TQQQ EMA Crossover Strategy is a powerful trading tool that utilizes Exponential Moving Averages (EMAs) to identify potential entry and exit points in the market. Key features of this indicator include:
**Fast and Slow EMAs:** The strategy incorporates two EMAs, allowing traders to capture short-term trends while filtering out market noise.
**Entry and Exit Signals:** Automated signals for entering and exiting trades based on EMA crossovers, enhancing decision-making efficiency.
**Customizable Parameters:** Users can adjust the lengths of the EMAs, as well as take profit and stop loss multipliers, tailoring the strategy to their trading style.
**Visual Indicators:** Clear visual plots of the EMAs and exit points on the chart for easy interpretation.
How It Works
The TQQQ EMA Crossover Strategy operates by calculating two EMAs: a fast EMA (default length of 20) and a slow EMA (default length of 50). The core concept is based on the crossover of these two moving averages:
- When the fast EMA crosses above the slow EMA, it generates a *buy signal*, indicating a potential upward trend.
- Conversely, when the fast EMA crosses below the slow EMA, it produces a *sell signal*, suggesting a potential downward trend.
This method allows traders to capitalize on momentum shifts in the market, providing timely signals for trade execution.
Trading Ideas and Insights
Traders can leverage the TQQQ EMA Crossover Strategy in various market conditions. Here are some insights:
**Scalping Opportunities:** The strategy is particularly effective for scalping in volatile markets, allowing traders to make quick profits on small price movements.
**Swing Trading:** Longer-term traders can use this strategy to identify significant trend reversals and capitalize on larger price swings.
**Risk Management:** By incorporating customizable stop loss and take profit levels, traders can manage their risk effectively while maximizing potential returns.
How Multiple Indicators Work Together
While this strategy primarily relies on EMAs, it can be enhanced by integrating additional indicators such as:
- **Relative Strength Index (RSI):** To confirm overbought or oversold conditions before entering trades.
- **Volume Indicators:** To validate breakout signals, ensuring that price movements are supported by sufficient trading volume.
Combining these indicators provides a more comprehensive view of market dynamics, increasing the reliability of trade signals generated by the EMA crossover.
Unique Aspects
What sets this indicator apart is its simplicity combined with effectiveness. The reliance on EMAs allows for smoother signals compared to traditional moving averages, reducing false signals often associated with choppy price action. Additionally, the ability to customize parameters ensures that traders can adapt the strategy to fit their unique trading styles and risk tolerance.
How to Use
To effectively utilize the TQQQ EMA Crossover Strategy:
1. **Add the Indicator:** Load the script onto your TradingView chart.
2. **Set Parameters:** Adjust the fast and slow EMA lengths according to your trading preferences.
3. **Monitor Signals:** Watch for crossover points; enter trades based on buy/sell signals generated by the indicator.
4. **Implement Risk Management:** Set your stop loss and take profit levels using the provided multipliers.
Regularly review your trading performance and adjust parameters as necessary to optimize results.
Customization
The TQQQ EMA Crossover Strategy allows for extensive customization:
- **EMA Lengths:** Change the default lengths of both fast and slow EMAs to suit different time frames or market conditions.
- **Take Profit/Stop Loss Multipliers:** Adjust these values to align with your risk management strategy. For instance, increasing the take profit multiplier may yield larger gains but could also increase exposure to market fluctuations.
This flexibility makes it suitable for various trading styles, from aggressive scalpers to conservative swing traders.
Conclusion
The TQQQ EMA Crossover Strategy is an effective tool for traders seeking an edge in their trading endeavors. By utilizing fast and slow EMAs, this indicator provides clear entry and exit signals while allowing for customization to fit individual trading strategies. Whether you are a scalper looking for quick profits or a swing trader aiming for larger moves, this indicator offers valuable insights into market trends.
Incorporate it into your TradingView toolkit today and elevate your trading performance!

Trend indicatorThe Trend Indicator script is a custom oscillator-based tool designed for identifying potential entry and exit points in the market. Using a combination of Exponential Moving Average (EMA) and Relative Moving Average (RMA) calculations, it captures the trend direction and signals market momentum shifts. The indicator visually presents buy and sell signals and color-codes background conditions based on potential trend reversals, offering a clear and structured approach for trend-based trading strategies.
Key Components
1. User Inputs
Smoothing Length (smoothLength): The script allows the trader to input a smoothing length for adjusting the EMA and RMA calculations. This parameter fine-tunes the indicator's sensitivity to price movements, where lower values result in a more responsive oscillator, while higher values make it smoother and less reactive to minor fluctuations.
Source (source): This is the price data input for the script, defaulting to the close price but customizable to other price points (e.g., open, high, or low) based on user preference.
2. Smoothed Price Calculation
Using an Exponential Moving Average (EMA), the script smooths the selected source price to reduce noise and make trends clearer. The EMA’s calculation length is determined by the smoothLength input, and this moving average forms the baseline from which other components derive.
3. Oscillator Calculation
The oscillator value represents the relative strength or weakness of price momentum. Here, the oscillator is computed using Relative Moving Average (RMA), applied to the difference between the smoothed price and the SMA of the source price. The RMA further filters short-term fluctuations to identify the core trend direction.
This oscillator measures the divergence between the smoothed price and the SMA, providing insight into whether the market is experiencing bullish or bearish pressure.
4. Signal Line
The Signal Line is a Simple Moving Average (SMA) of the oscillator, using the same smoothLength parameter. The SMA smooths the oscillator’s values, offering a secondary reference that traders can use to identify changes in momentum when it crosses the oscillator line.
5. Buy and Sell Signals
Buy Signal (bullSignal): The script triggers a buy signal when the oscillator crosses above zero. This indicates that momentum may be shifting in favor of buyers, potentially signaling an uptrend.
Sell Signal (bearSignal): The script triggers a sell signal when the oscillator crosses below zero, suggesting a shift in momentum to the downside, potentially initiating a downtrend.
Visualization
1. Plotting the Oscillator and Signal Line
The oscillator line is plotted in blue, representing the current momentum of the price. The signal line, plotted in red, serves as a smoother baseline.
When the oscillator crosses the signal line, it hints at a potential trend shift, which can be a signal for cautious traders to pay attention to trend reversals.
2. Buy/Sell Signal Markers
Buy Signal Marker: A green label appears below the bar whenever the oscillator crosses above zero, indicating a potential buying opportunity.
Sell Signal Marker: A red label appears above the bar whenever the oscillator crosses below zero, marking a potential selling opportunity.
These visual cues make it easy for traders to spot signals directly on the chart without needing to watch the oscillator values closely.
3. Background Coloring for Trend Direction
To further aid in trend identification, the background color changes to green when a bullish signal is active and red during bearish signals. This coloring helps visually reinforce the current trend direction, allowing traders to spot prolonged uptrends or downtrends easily.
Trading Strategy Suggestions
This indicator can be adapted to various trading strategies. Here are a few practical suggestions:
Trend-Following Strategy:
When the oscillator crosses above zero (green background), it could indicate the start of a potential uptrend. Consider entering a long position on this signal and holding it until the oscillator crosses back below zero.
Conversely, a cross below zero (red background) may signal a downtrend, making it suitable for short positions or exiting long trades.
Cross-Confirmation with Signal Line:
Use the crossover of the oscillator and signal line to confirm trends. For example, when the oscillator is above zero and crosses above the signal line, it could reinforce a strong buy signal. Similarly, a cross below the signal line when the oscillator is below zero could strengthen a sell signal.
Combining with Other Indicators:
For added accuracy, combine this indicator with other trend-confirming tools like Moving Averages or Bollinger Bands to confirm the validity of buy/sell signals.
Risk Management:
Always set stop-losses below recent lows in uptrends or above recent highs in downtrends. This indicator is useful for entry and exit points but should always be paired with solid risk management practices.
The Trend Indicator is a comprehensive tool for identifying market momentum and potential reversal points. By smoothing out price data and using an oscillator to track momentum shifts, it offers traders a structured approach to trading trends. Its built-in buy/sell markers and background coloring make it visually accessible and easy to interpret at a glance. However, as with any indicator, it's most effective when combined with other strategies and a disciplined approach to risk management.